Equivalence Testing the Volume Study
It's been over 6 months since our study on volume and hypertrophy was first published online ahead of print, and the study still generates a lot of online discussion. Much of it at this point is just rehashed discussion points that have already been thoroughly discussed. However, what does warrant some further investigation is the statistical analyses. The objective of this post is to introduce a new statistical analysis that I had originally planned on using for this study, but ultimately decided not to as I felt it would result in an overly complicated statistics and results section, and didn't sufficiently add to the analyses I had already done. But given the critiques of our interpretation of the Bayes Factors, it is worth providing a different analysis. This post can also help people understand the problems with Null Hypothesis Significance Testing (NHST), and how there is a frequentist (rather than Bayesian) alternative that allows you to get an idea of how much support there is for the "null" hypothesis (versus just rejecting it or failing to reject it).
Key Takeaways
- People often misinterpret statistically non-significant results. Absence of evidence is not evidence of absence.
- People also misinterpret Bayes Factors, and rely too heavily on classifications when they are meant to be continuous measures of evidence. Bayes Factors are context dependent, and one that might be "hardly worth mentioning" in one context may be positive evidence in another context.
- Unlike NHST, equivalence testing provides a frequentist method for assessing the degree of evidence in favor of the "null" hypothesis. It is often used in pharmaceutical research to compare the effectiveness of different drugs.
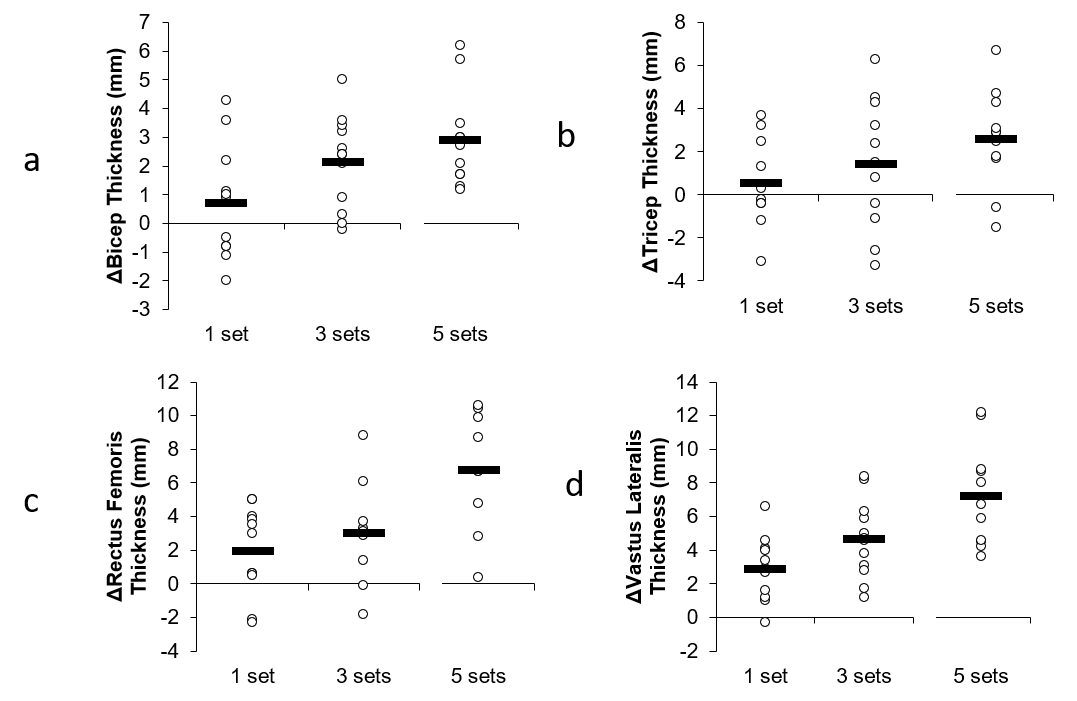
- Equivalence testing our volume study supports a dose-response relationship. It showed 5 sets to be greater than 1 set in all muscle groups and 5 sets to be greater than 3 in two muscle groups. 3 was nearly greater than 1 in two muscle groups. Other differences could not be determined. None of the comparisons could be considered equivalent.
The Problems with People's Interpretations of NHST
Under the NHST framework, it is common for people to see a statistically non-significant effect (like P = 0.15), and then claim "there is no effect." However, a non-significant effect does not mean "no effect." It only means we failed to reject the null hypothesis of no difference. But this does NOT mean there is support for the null hypothesis. It could be that we simply had insufficient subjects to reject the null hypothesis. In other words, absence of evidence is not evidence of absence. For a much more thorough discussion of this, I recommend this excellent blog post by Zad Chow entitled "When Can We Say That Something Doesn't Work?"
The Problems with People's Interpretations of Bayes Factors
The use of Bayesian alternatives and Bayes Factors provide an advantage over NHST. Bayes Factors can tells us how much evidence there is to support the null hypothesis compared to how much support there is for the alternative hypothesis. In our volume study, we used both NHST and Bayes Factors. The Bayes Factors indicated there was positive-to-strong evidence of differences between the groups in terms of gains for three out of the four tested muscle groups. When doing a post-hoc analysis to determine where the specific differences lied, we found evidence of 5 sets being greater than 3 sets, with Bayes Factors in the 2-3 range.
Of course, just like with NHST, people misinterpreted these Bayes Factors to mean no difference. But, as I thoroughly discussed in this blog post (which I don't intend to rehash here), that is not what the Bayes Factors mean. A Bayes Factor of 2.25 means there is 2.25 times more support for the alternative hypothesis (5 sets greater than 3 sets) than the null hypothesis (no difference between 5 and 3). While this is not strong, it can still be considered meaningful, particularly for individuals trying to make decisions on how to structure their training programs. Some individuals got hung up on Bayes Factors classifications (which are problematic in and of themselves), citing Kass and Raftery's classification of 1-3 as "barely worth mentioning." Of course, they fail to mention that there are other classifications (and that "barely worth mentioning" was eventually replaced with "anecdotal"), and also fail to understand that Bayes Factors aren't meant to be classified. They are a continuous measure of evidence:
https://www.r-bloggers.com/what-does-a-bayes-factor-feel-like/amp/
These labels can also be a dangerous tool, as they implicitly introduce cutoff values (“Hey, the BF jumped over the boundary of 3. It’s not anecdotal any more, it’s moderate evidence!”). But we do not want another sacred .05 criterion!; see also Andrew Gelman’s blog post and its critical comments. The strength of the BF is precisely its non-binary nature.
The people who have criticized our interpretation of the Bayes Factors also fail to understand that the interpretation of these factors is context dependent (which is why one should be careful of using classification systems).
https://www.r-bloggers.com/what-does-a-bayes-factor-feel-like/amp/
The bad thing about labels is that an interpretation should always be context dependent (Such as “30 min.” can be both a long time (train delay) or a short time (concert), as @CaAl said). But once a categorical system has been established, it’s no longer context dependent.
So what does a Bayes Factor in the 2-3 range mean? How strong is it? As mentioned in this blog post, imagine you have a bag of blue and red marbles, and you are curious if there is an uneven distribution of marbles in the bag. So, you draw a sample of marbles from the bag and look at how many red versus blue marbles you get. You then use the data from this sample to make an inference as to how likely there is an uneven distribution in the entire bag.
If you draw 22 marbles (16 reds and 6 blues), that would give you a Bayes Factor of 2.89 (the supposed "barely worth mentioning" Bayes Factor). Here's what your sample would look like:
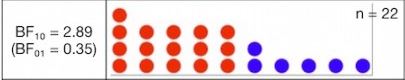
Would you consider this as "no evidence" that there is an uneven distribution of marbles in the bag? Probably not. In fact, most people would look at this and think, "There's probably an uneven distribution in the bag." Yet this is a similar Bayes Factor to what we observed when we compared 5 sets to 3 sets in the legs, and some people tried to claim there wasn't a difference or that the odds of a difference were too small to conclude there probably was one. Now, is this strong evidence that there is an uneven distribution in the bag? No, as this sample could be drawn from an even distribution based on random chance. But, it is 2.89 times more likely that the bag distribution is uneven, and thus concluding "there's probably an uneven distribution" is consistent with the evidence.
Bayes Factors, just like P values, are impacted by sample size. Here's how your Bayes Factor changes as the sample of marbles increases.
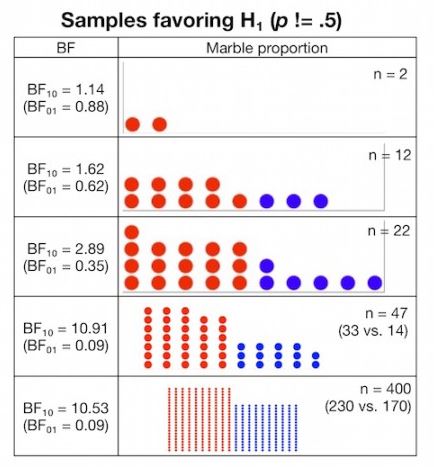
When interpreting the Bayes Factors in our study, one must consider the context, which all of the critics of our Bayes Factor interpretations have failed to do. In the context of our study, given the small sample size, the increasing stair-step pattern observed across all 4 muscle groups, the fact that similar results were observed in a study with similar design, the fact that people looking to maximize hypertrophy are more interested in avoiding false negatives than false positives, etc., then it is certainly reasonable to interpret our Bayes Factors as evidence that 5 sets was probably greater than 3. What the BF critics don't understand is that interpretation of statistics is subjective. There's no such thing as certainty. As I explained here, a BF of 3.1 doesn't suddenly become meaningful where a BF of 2.9 is "barely worth mentioning." Science doesn't work that way. Science works in degrees of confidence, and the context matters.
Equivalence Testing the Volume Study
Another way we can look at the data is through equivalence testing. I had originally planned on doing equivalence testing in this study in addition to the NHST and Bayesian analyses, but ultimately decided not to include it as I thought it would needlessly complicate the reporting without adding a lot of new information over the other two analyses, as it would involve multiple comparisons. However, equivalence testing provides an advantage over NHST as it can provide evidence in support for the null hypothesis. And, unlike Bayesian analyses, there's no need to specify a prior. Equivalence testing is commonly used in pharmaceutical research to compare the effectiveness of drugs. We can also use it in the context of this study, to compare the effectiveness of different volume levels for stimulating hypertrophy. For more detailed discussions of equivalence testing, check out this blog post by Zad Chow and this blog post by Daniel Lakens. Equivalence testing allows us to determine whether a meaningful effect exists. To quote Daniel Lakens:
http://daniellakens.blogspot.com/2016/05/absence-of-evidence-is-not-evidence-of.html
Equivalence testing has many benefits. It fixes the dichotomous nature of NHST. You can now 1) reject the null, and fail to reject the null of equivalence (there is probably something, of the size you find meaningful), 2) reject the null, and reject the null of equivalence (there is something, but it is not large enough to be meaningful, 3) fail to reject the null, and reject the null of equivalence (the effect is smaller than anything you find meaningful), and 4) fail to reject the null, and fail to reject the null of equivalence (undetermined: you don’t have enough data to say there is an effect, and you don’t have enough data to say there is a lack of a meaningful effect).
To do equivalence testing in the context of the volume study, I would be doing equivalence tests comparing 1 set to 3 sets, 3 sets to 5 sets, and 1 set to 5 sets. Since this involves multiple comparisons, we need to adjust our alpha to keep the "family-wise" alpha at 0.05. To do this for equivalence testing, we divide the alpha by k-1 (where k is the number of comparisons). In our case, since we're doing 3 comparisons, k-1 = 2 so our new alpha is 0.05/2 = 0.025. We also need to decide upon the size of the effect we are interested in. In our case, we'll choose a standardized effect size (Cohen's d) of 0.5, which by most standards is considered a "moderate" effect. In other words, is there evidence that one volume group differs by the another by at least a half standard deviation?
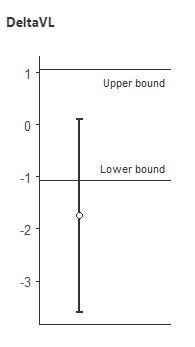
Using the TOSTER package in Jamovi, I ran equivalence tests for all of the muscle thickness comparisons. Let's now look at the equivalence tests for 3 vs. 5 sets on the rectus femoris and vastus lateralis (the two muscle groups where the Bayes Factors were in the 2-3 range for this comparison). To interpret these graphs, if the error bars do not cross zero and the point estimate is outside the upper/lower bound range of -0.5 to 0.5, then we can conclude there is a meaningful difference.
Here's 3 vs. 5 sets for rectus femoris:
Here's 3 vs. 5 sets for vastus lateralis:
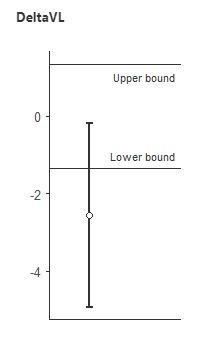
In both cases, we conclude that 3 and 5 sets are NOT equivalent, and that there is a meaningful difference between them. This is certainly the opposite of "hardly worth mentioning", and is in line with the conclusion from the Bayes Factors that 5 was probably greater than 3.
Here's a table of the equivalence test outcomes for all the comparisons.
| 1 vs. 3 | 3 vs. 5 | 1 vs. 5 | |
| Biceps | ? (but very close to 1 < 3) | ? | 1 < 5 |
| Triceps | ? | ? | 1 < 5 |
| Rectus Femoris | ? | 3 < 5 | 1 < 5 |
| Vastus Lateralis | ? (but very close to 1 < 3) | 3 < 5 | 1 < 5 |
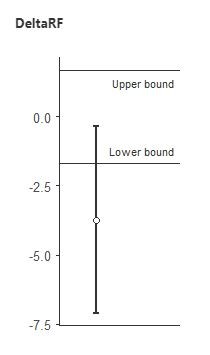
In this table, "?" means it is undetermined whether the two are equivalent. Here's what an "undetermined" equivalence interval looks like (this is for 3 vs. 5 sets in biceps):
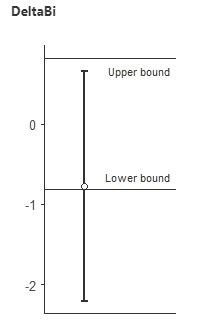
Not that this does NOT mean they are equivalent, as the interval is not fully contained within the upper and lower bounds. Thus, anyone claiming that our study showed 1 = 3 or 3 = 5 are not understanding the statistics. We could only claim equivalence if intervals were contained in the -0.5 to 0.5 effect size bounds, which none of them were (in fact, none were even close to showing equivalence). Note that there are no "=" signs in the table.
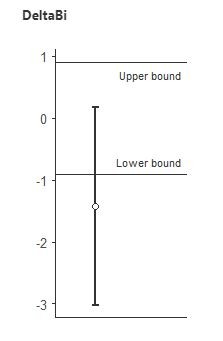
The 1 vs. 3 comparison for vastus lateralis and biceps were extremely close to showing a meaningful difference, as the intervals barely crossed zero.
It is clear that the equivalence table shows evidence of a dose-response relationship. 5 sets was greater than 1 in all muscle groups, and 5 was greater than 3 in two of the four muscle groups. Two muscle groups were close to non-equivalence for 3 vs. 1. Thus, claims that our conclusions that there is evidence of a dose-response relationship were not justified are, in fact, not justified.
Summary
Equivalence testing is quite common in pharmaceutical research, but is mostly absent in the exercise science field (which, in my opinion, should change). It provides numerous advantages over NHST, and is done in a frequentist framework. In future papers I will likely use a combination of equivalence testing and Bayesian methods, as they are more consistent with how science is supposed to work (assessing degrees of evidence, rather than using binary "significant" or "non-significant" decisions).
Conclusions in science are based on degrees of evidence, and are always tentative. They are context dependent, and one must take a "big picture" approach when drawing conclusions from a study. The combination of equivalence testing, the consistent stair-step pattern of outcomes, the Bayes Factors favoring an effect, and the similarity of outcomes to another independent study with a similar design, is supportive of the conclusion that there is likely a dose-response relationship. Of course, this is just one study, and given the small sample sizes in resistance training studies, one should never place too much emphasis on the outcome of any single study. For a thorough analysis of how this study fits among others in the field, and for a dose-response curve derived from all these studies, check out the Volume Bible in my Research Review.