Responding to Critiques of Our Volume Study
I recently collaborated with Brad Schoenfeld, Bret Contreras, Jozo Grgic, and others on a study examining the impacts of resistance training volume on muscle hypertrophy. I won't go into the specifics or details of this study, as I will be saving it for my research review. You can also find Brad's discussion of the study here if you'd like more details on the study design and results. The purpose of this blog post is to offer a detailed response to many of the critiques that have been surfacing. In fact, some of the critiques have elevated to the level of personal attacks on the integrity of the researchers involved. I'll outline a number of the criticisms, and show why the criticisms are misguided or invalid.
- "Your Statistics Were Right, But Your Interpretation is Wrong...Your Data Does Not Support a Dose Response Relationship"
- "The Strength Data Came Out The Same, and Strength and Size Are Directly Related, So The Data Doesn't Support A Relationship" or "The Extra Gains Were Water or Edema Because The Strength Gains Were The Same"
- "You misrepresented the Ostrowski study, proving what you wanted to"
- "It's Catch-Up Growth"
- "You Used the Wrong Statistics"
OK, so let's get to each one.
"Your Statistics Were Right, But Your Interpretation Is Wrong...Your Data Does Not Support A Dose Response Relationship"
This appears to be based off of misconceptions on what a dose-response relationship means, and also misconceptions on how science works.
First, a dose-response relationship doesn’t mean a linear relationship that continues indefinitely. It could also mean a U shaped relationship, a curvilinear relationship, or some other non-linear relationship.
Second, many conclusions in science are not 100% certain. We base our level of certainty on the amount of data we have. For example, evolutionary theory is, for all practical purposes, nearly 100% certain because of the overwhelming data from a large number of different disciplines to support it. Now, contrast that with a training study, looking at a metric (hypertrophy) that has substantial variability from one individual to the next. On top of that, we have a small sample size. This dramatically increases the level of uncertainty in our conclusions. We attempt to quantify some of that uncertainty using statistical analysis. For example, you could have data where you are 60% certain, or 70% certain of a conclusion. However, I've seen people taking that uncertainty level and turning it into a claim of “no effect.” That is incorrect.
It was claimed that the Bayes factors in our study don’t support a dose-response relationship. For example, because the BF10 for the quadriceps data was a bit more than 2, which is considered “weak” according to some classifications, people were claiming “no effect.” That is false. A BF10 of 2 means that the likelihood of 5 being more than 3 is twice as high as the likelihood of no difference (the null). This IS evidence that 5 was better…it’s just not strong evidence. But it is erroneous to say we can’t conclude a dose-response relationship because the BF10 was weak.
If I was to tell you that it was twice as likely to have a rainstorm as it was not to have one, would you bring your umbrella? Or would you claim, “Nope, no evidence that it’s going to rain.” However, some of the people using this criticism are essentially taking the latter position. Is a BF10 of 2 strong evidence that it’s going to rain? No, but it’s still enough to get you to grab your umbrella. And if I’m a bodybuilder looking to maximize hypertrophy, I’m most likely going to take that bet as well.
The criticisms I've seen of our paper are a demonstration of how people struggle with the idea of probabilistic thinking. Our conclusions of a graded dose-response relationship is based off of probabilistic thinking. Are we certain that there’s a dose-response relationship? Is there strong evidence of it? Of course not, and we never claimed as such. But the evidence is there nonetheless.
It should also be remembered that our data are statistically adjusted for multiple comparisons. This, by default, weakens our statistical power to help prevent a type I error (false positive). However, on the same token, it increases the probability of a type II error (false negative). This is one of the reasons we used Bayes Factors, but even there, the prior odds were adjusted for multiple comparisons. Thus, it weakens the strength of the evidence for 3 versus 5 sets, but it does not falsify it or indicate “no difference”.
True evidence of “no difference” between would be a BF10 of less than 0.33. A BF10 of 1 means that both a difference and no difference are equally as likely. But for the quadriceps data, the BF10’s exceeded 2, which means a difference between 3 and 5 was twice as likely as no difference. Thus, the weight of the evidence is for a difference. In fact, it’s a bit of a stretch to claim “no difference” between 3 and 5 when the average response in 5 was approximately double of that in 3.
In fact, with a small sample size and a marker of hypertrophy with tremendous interindividual variability, I would be shocked to see “strong” evidence of a difference between 1 and 3 or 3 and 5. The only way you’re going to get that is with a very large sample size, given the interindividual variance. Thus, the fact that there was strong evidence of 1 vs 5, and weak evidence for 1 vs 3 and 3 vs 5, certainly can be considered evidence of a dose-response relationship considering the limitations of the dataset. Strong evidence of a dose-response relationship? No, but certainly good enough to make a probabilistic inference that one likely exists. Could that inference be wrong? Of course, but we would need more studies to know that.
This is where replication comes in. The fact is, our study design was nearly identical to Radaelli and colleagues (1 vs 3 vs 5 sets, three times per week), except we had trained subjects. And the pattern of our results were similar to theirs for biceps thickness (they did not measure quadriceps so we can’t compare there), and they also found the greatest gains in tricep thickness in the highest volume group. Lyle McDonald has claimed that the results of Radaelli should be thrown out because the triceps data showed almost no gains in the two lower volume groups. However, what he and others who have not done studies with human subjects fail to understand is that, when you’re working with human subjects and small samples, your data rarely comes out “neat” or clean. You could do 5 different studies with the exact same design but with different subjects, and sometimes get weird results just by chance. This does not invalidate the study. You don’t throw out a study because you don’t like the results or that the result don’t look neat to you. You throw out a study if it has terrible methodology, or if there’s evidence of data fabrication or manipulation (like with Jacob Wilson or Brian Wansink of Cornell…here’s an example of finding evidence of data manipulation https://medium.com/@OmnesRes/cornells-alternative-statistics-a8de10e57ff). The Raedaelli study is probably one of the most well-controlled studies in this area, given that it was done on Brazilian navy men confined to an aircraft carrier, and was carried out for 6 months (rather than the usual 6-12 weeks of other studies). There is no valid reason to throw out the results.
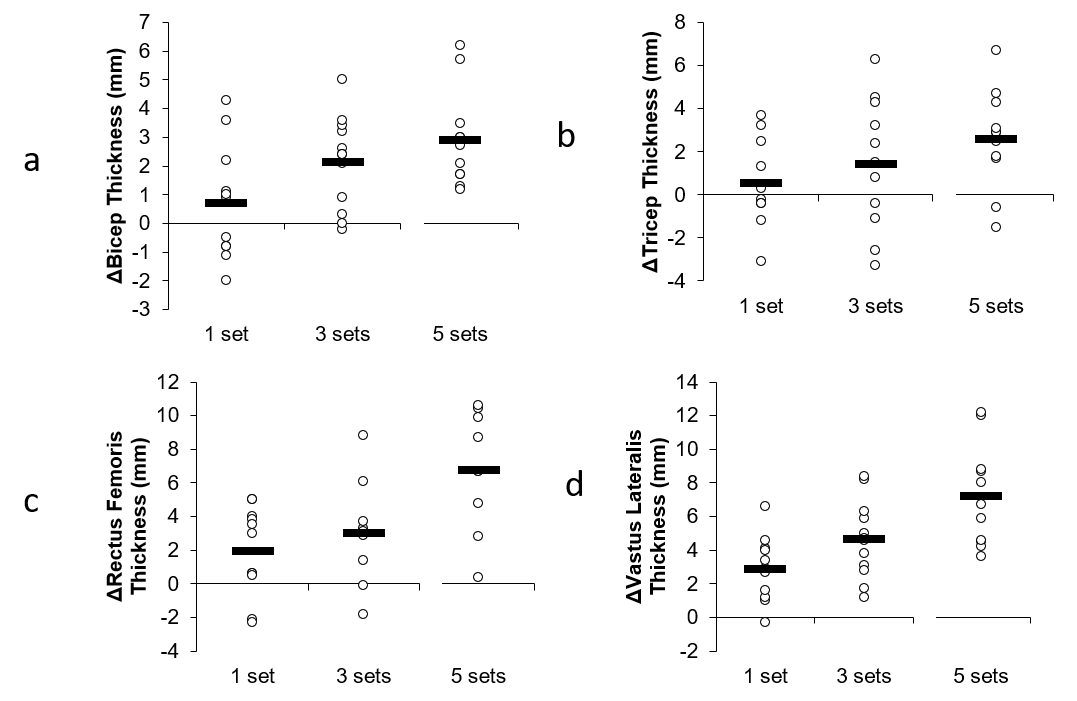
Even our original graphs support a dose-response relationship. Here’s the graphs we originally submitted to the journal:

It was asked why these graphs aren’t in the final published version of the paper. It’s because one of the reviewers asked us to remove them and provide the graphs that you now see in the published version. Personally I feel the original graphs gave a better presentation of the data and individual responses, but sometimes you have to make compromises with reviewers and pick your battles.
The fact is, the pattern of outcomes was similar between all the muscle groups, even though the statistics did not end up being significant for all of them. Now, could this all just be due to random chance? Yes, of course, but, as stated earlier, the odds favor that it is not.
"The Strength Data Came Out The Same, and Strength and Size Are Directly Related, So The Data Doesn't Support A Relationship" or "The Extra Gains Were Water or Edema Because The Strength Gains Were The Same"
While strength gains and size gains are related, the relationship is not as tight as some people might believe, even in trained subjects. The relationship is not 1:1, which I discuss further in this piece on progression in my research review (members only). In fact, in that piece, I show a number of studies that question how tight the relationship is between 1-RM gains and hypertrophy, even in a study consisting of repetitions in the 8-12 range like our study. This may be particularly true for compound movements, which were the tested movements in this study (1-RM bench and squat). This is because there is much more related to the performance of a compound movement than just the size of the primary movers involved. For example, you could have two groups, and one experiences a greater increase in triceps size, but it may not necessarily be reflected in 1-RM bench press performance since there are numerous other muscle groups involved, as well as neural factors (which can change even in well trained subjects). In our study, NO correlation between changes in thigh muscle thickness and changes in squat 1-RM, or changes in tricep thickness and changes in bench 1-RM were observed. If changes in strength and size were the same, then you would see a strong correlation between these measures.
Now, one might argue that there's a lack of relationship between size and strength gains because the highest volume group is due to edema or glycogen or some other non-contractile factor, and this washes out the correlation. However, even if we isolate the correlation analysis to the lowest volume group, there is no correlation (r = 0.03, P = 0.93).
People also point to the study by Huan and colleagues where the researchers reported that the lean mass gains from a training volume >20 weekly sets were primarily due to extracellular water, and thus edema. Extracellular water was assessed using bioelectrical impedance spectroscopy. However, to my knowledge, the use of BIS to estimate changes in ECW and ICW in healthy individuals, specifically as a marker of edema in those populations, has not been validated. Also, people pointing to the Huan study are completely ignoring the muscle thickness data in that study. Quadriceps muscle thickness showed a tendency to decrease at the midpoint of the study, then return to normal by the end of the study when training volume was the highest. Bicep thickness increased at the midpoint (before training volume got extremely high), then remained about the same. If the gains in our study are purely due to edema, why doesn't the muscle thickness data in the Huan study show a progressive increase as well? In fact, Huan et al. did their ultrasound measurements 24 hours after training sessions, when edema would peak. If edema was an issue, why doesn't it show up in the ultrasound measurements in this study? Also, if the gains are due to edema, why doesn't the muscle thickness data in the Heaselgrave study show a progressive increase in edema with increasing volumes? If edema was a true factor in our results, you would see more consistency across studies using very high volumes.
ADDENDUM 9/4/2018: My colleagues Brad Schoenfeld and Andrew Vigotsky have had further comments on the use of BIS to try to estimate edema:
Brad: The extracellular water measure in BIS represents all water outside of the cell. This doesn't differentiate subcutaneous water from water in the intersitial spaces (i.e. tissue edema). Any subcutaneous water would have zero impact on a modality such as ultrasound, which measures from the fat/muscle interface to the bone and thus excludes subcutaneous water (although it would affect the DXA measurements). Also, Haun tested 24 hours post-exercise, which would potentially have some residual effects of mild muscle damage. And Haun also ramped up volume each week, which conceivably would be a novel stimulus that may have promoted slightly more muscle damage from the novelty effect.
Andrew: I'm really concerned about the specificity of BIS, though. If we can't tell from which tissue the changes in water content arise, then I don't find it very useful. It's a guessing game.
Brad Schoenfeld has also addressed the edema issue, pointing out that the repeated bout effect would minimize or eliminate changes in edema. I've seen some people link to this study showing muscle swelling in trained subjects after 9 sets of leg press and squats to failure. While the subjects in that study had experience with squat and leg press, they typically only trained legs once per week, which would limit the repeated bout effect, and make swelling more likely from such an acute session.
ADDENDUM 9/5/2018: Some individuals have linked to this study showing swelling 48 hours after a bout of repeated sprints. However, in this study, a group of rugby, soccer, and field hockey players were subjected to 15 repeated 30-meter sprints, with rapid 10 m deceleration (resulting in a heavy eccentric component), with only 60 seconds rest. Thus, it would be expected that such activity would be damaging to tissue in an acute sense, especially since the players had not been trained in this specific protocol. They also only competed once per week, which would minimize any repeated bout effect from their sport activities. Finally, testing was done on a hard surface, when the subjects were accustomed to competing on soft surfaces.
The problem with these acute studies is that, even if the subjects are well trained, they are not well trained in the protocol that is specific to the study. Even well trained subjects can experience significant soreness and edema when training with a protocol to which they are not accustomed. In my own personal experience, if I do a high volume of a specific exercise that I haven't done in a while, I will get sore. And that's true even if the exercise is only a variation of exercises I've been regularly performing. This is why people should be cautious when trying to extrapolate acute protocols to chronic protocols, because even the well trained subjects aren't well trained in the specific protocol being used. As I stated above, if swelling was indeed the reason for the results, then you would see more consistency in the results of chronic training studies. The paper by Huan and colleagues , a chronic training study, measured muscle thickness a mere 24 hours after training, yet there was no evidence of swelling according to the ultrasound data In fact, the muscle thickness changes in the Huan paper were quite small, despite ramping the volume up to over 30 weekly sets, which would refute any notion of swelling.
Finally, leg extension load volume data from our study refutes the notion that the changes are due to edema. I ran an analysis on the right leg extension (since it's an isolation rather than compound movement, and thus neural factors don't play as much of a role, and also ultrasound measurements were done on the right leg), comparing the percentage change in load volume from the first week of the study to the last week of the study. The results show a strong trend (P = 0.057, just missing significance) for a graded impact of set volume on the improvements in leg extension load volume.
- 1 set group: 23.8% improvement
- 3 set group: 33% improvement
- 5 set group: 54% improvement
There was also a significant correlation between the percentage improvement in VL thickness and the percentage improvement in leg extension load volume (r = 0.40; P = 0.02). There was a trend towards a correlation between the improvement in RF thickness and the percentage improvement in leg extension load volume (r = 0.34; P = 0.075). These results contradict the idea that the hypertrophy is due to edema.
" You misrepresented the Ostrowski study, proving what you wanted to"
The idea that we set out to somehow "prove what we wanted" is one of the most absurd accusations regarding this study. First, it completely ignores the fact that both Brad and I have changed our minds numerous times based on new data. Here's a quote from Brad regarding how he's changed his mind numerous times:
- In my 2012 book MAX Muscle Plan, I stated the following:1. Light loads don't build appreciable muscle; my own research debunked that opinion, and actually showed a hypertrophic benefit to light load training for the biceps: https://www.ncbi.nlm.nih.gov/pubmed/25853914.
2. I included a four week microcycle using a three day bro-split; my own research showed a full body routine was superior for growth: https://www.ncbi.nlm.nih.gov/pubmed/25932981
3. I advocated shorter rest periods in the hypertrophy cycle to elicit higher metabolic stress; my own research showed longer rest periods were better for hypertrophy: https://www.ncbi.nlm.nih.gov/pubmed/26605807
4. I devoted half a chapter to the importance of nutrient timing; now I'm considered the anti-nutrient timing guy because of my research: https://www.ncbi.nlm.nih.gov/pubmed/24299050
5. Finally and ironically, even in the highest volume microcycles, I never advocated more than 25 sets/week for quads! Why on earth would I have an impetus to show even higher volumes are beneficial?
Like Brad, I used to share some of the same opinions as him on these topics, and changed my mind as well. I've also changed my mind on my own published research regarding low carb diets, as I outlined in this blog post.
One of the reasons Brad carried out this study was because of the limited data involving high volumes and limited data on trained subjects. In fact, a few years ago I was the one that contacted Brad and said it would be great to replicate the Radaelli paper in trained individuals. He said it was a great idea, and had had no previous intentions to study the topic. We wanted to see what would happen with higher volumes than what you typically see. The outcomes of this paper, in fact, surprised me, as I expected a plateau at moderate volume.
When Brad first started this study, I was hoping that there would be no differences between groups (or, better yet, superior results for the lowest volume). However, my expectation was there would be a plateau. The data met neither. Thus, any conception that “we found what we wanted to find” is 100% false.
Also, the whole idea of Ostrowski being misrepresented is a strawman.
Here's an example of Ostrowski being misrepresented:
"Similar to our paper, Ostrowski et al observed a dose response relationship for hypertrophy", and then go and leave out the middle value.
But that's not what was said in the paper. Here is what was actually said. Read what is actually said...not what you think is being said.
Only one previous study endeavored to examine the dose-response relationship (i.e., a minimum of three different set volumes) between training volume and muscle growth in resistance-trained individuals using site-specific measures of hypertrophy (11). In the 10-week study, resistance-trained men were allocated either to a: (a) low volume group (3-7 sets per muscle group per week); (b) moderate volume group (6-14 sets per muscle group per week); or (c) high volume group (12-28 sets per muscle group per week). Results showed that percent changes and ESs for muscle growth in the elbow extensors and quadriceps femoris favored the high-volume group. However, no statistically significant differences were noted between groups. When comparing the results of Ostrowski et al. (11) to the present study, there were notable similarities that lend support to the role of volume as a potent driver of hypertrophy. Changes in triceps brachii MT in Ostrowski et al. (11) study were 2.2% for the lowest volume condition (7 sets per muscle/week) and 4.7% for the highest volume condition (28 sets per muscle/week). Similarly, our study showed changes in elbow extensor MT of 1.1% versus 5.5% for the lowest (6 sets per muscle/week) versus highest (30 sets per muscle/week) volume conditions, respectively. Regarding lower-body hypertrophy, Ostrowski et al. (11) showed an increase of 6.8% in quadriceps MT for the lowest volume condition (3 sets per muscle/week) while growth in the highest volume condition (12 sets per muscle/week) was 13.1%. Again, these findings are fairly consistent with those of the present study, which found an increase in mid-thigh hypertrophy of 3.4% versus 12.5% and lateral thigh hypertrophy of 5.0% versus 13.7% in the lowest and highest volume conditions, respectively. It Copyright © 2018 by the American College of Sports Medicine. Unauthorized reproduction of this article is prohibited.
should be noted that the lower-body volume was substantially greater in our study for all conditions compared to Ostrowski et al. (11). Interestingly, the group performing the lowest volume for the lower-body performed 9 sets in our study, which approaches the highest volume condition in Ostrowski et al. (11), yet much greater levels of volume were required to achieve similar hypertrophic responses in the quadriceps. The reason for these discrepancies remains unclear.
The section compares the similarities in percentage gains between the lowest and highest volumes. There is no mention of a dose response relationship. The only comment is that the fact that the highest volumes show greater percentage gains than the lowest volumes is support for the idea that volume plays an important role in hypertrophy.
That's it. And that makes sense. If I've got two studies, and the two extremes in volume show meaningful differences in percentage gains, then set volume obviously plays a role in hypertrophy. The fact that the middle value was left out is irrelevant to that conclusion. It would only be relevant if either a dose response relationship was claimed (which it wasnt), or if the middle value was radically different in a random fashion (like if it went 5%, 1%, then 13%).
Now, I can understand how someone might read this and infer that we were claiming a dose-response relationship in Ostrowski, even though it was never claimed. We never intended to make such an implication, so any claims to the contrary are simply a misunderstanding. And anyone trying to claim anything different are assigning intent to us without actually knowing the intent.
Finally, a quote by my friend Eric Helms also illustrates why anyone who thinks we were misrepresenting Ostrowski is mistaken:
(We) specifically pointed out that the "high volume condition" in Ostrowski was comparable in terms of numbers of sets to the low volume condition in the present study, but that the gains were similar. Here's the quote: "It should be noted that the lower-body volume was substantially greater in our study for all conditions compared to Ostrowski et al. (11). Interestingly, the group performing the lowest volume for the lower-body performed 9 sets in our study, which approaches the highest volume condition in Ostrowski et al. (11), yet much greater levels of volume were required to achieve similar hypertrophic responses in the quadriceps." That completely deflates any argument that this is a biased attempt at misrepresenting the study in order to push the high volume agenda. It directly stands against that hypothesis, as they are saying in Ostrowski they did one fourth the volume and got just as much gains....
"It's Catch-Up Growth"
This was based on the fact that some of the means for the muscle thickness in the highest volume group were non-significantly lower; the idea is that they simply "caught up" to the other groups, and thus there's no true effect of volume. This hypothesis was originally put forth by Lyle McDonald, although he has since changed his mind on that. However, it is important to point out the problems with this for anyone who still thinks this.
We ran a statistical analysis that adjusts for differences in baseline values (ANCOVA on change scores, with baseline as a covariate). Thus, our statistical models would account for any small differences in baseline values. We still saw a dose-response relationship even after adjusting for baseline values.
You also can't just look at mean responses and then assume "catch-up growth". The idea of "catch-up" growth is based on the idea that an individual with a lower baseline muscle thickness will tend to have larger gains than an individual with a higher baseline muscle thickness, regardless of what program the person is on. However, there is no data to suggest this to be true. In fact, baseline muscle is not predictive of how much muscle you'll gain.
Also, you can't just look at the average, and conclude that it's catch-up growth if the final average ends up being similar to the other groups. This is because the means don't tell you what happened in the individuals. Remember that there is a distribution of subjects around the mean. The mean can increase if all subjects experience muscle growth, or if just some subjects experience an increase in muscle growth. When you claim "catch-up" growth based on means, you are ASSUMING that the increase is due to the people with lower baseline thickness (i.e., the people near the bottom of the distribution of that particular group) catching up to the people with higher baseline thickness. However, in this same group, you can have people with higher baseline thickness having large improvement, and people with lower baseline thickness not showing much improvement, and get the EXACT SAME INCREASE IN MEAN as if you had the opposite. This is why you can't conclude catch-up growth based on averages.
This is where the ANCOVA comes in. The ANCOVA makes adjustments for the baseline value of every single individual (rather than the group as a whole). If the baseline value correlates with the response, the ANCOVA adjusts the response downward according to the strength of the correlation. It essentially levels the playing field. If the growth is "catch-up" growth, then any significant effect of volume would disappear in an ANCOVA. But it did not, indicating that the growth is NOT "catch-up" growth.
The idea of "catch-up" growth is not even consistent with all of the data. For example, in biceps thickness, the 3 set group had the highest raw mean by at least 2 mm. If the outcomes were simply due to catch-up growth, then the 3 set group should have had the smallest increase...yet it did not.
"You Used the Wrong Statistics"
It had been claimed by some that we used inappropriate statistics and should've done a different analysis, like linear regression. Some went as far to say that we were manipulating the statistics to get what we wanted.
Our statistical analyses were chosen ahead of time before I received the data. Also, our statistical analyses were common analyses chosen for a study design like ours. In general, the analyses that are typically done for these designs are:
1. Repeated measures ANOVA, with group and time as factors
2. Mixed models for repeated measures, with subject as a random effect, and group and time as fixed effects
3. ANCOVA on the group changes, adjusting for baseline values as the covariate
We had originally chosen methods 1 and 3. One reviewer came back and felt that the method 1 was redundant and also didn't adjust for baseline values, so that's why there's only ANCOVA in the final paper. The results from method 1 were essentially the same as for method 3. Method 2 would not have been any different from method 1 with only two time points (pre and post); when you start to have 3 or more time points, than method 2 is preferable to method 1 (although the results will still not be much different).
The ANCOVA in fact is the most conservative of the three due to the adjustment for baseline. Thus, anyone claiming that we're somehow using statistical magic to try to get the results we want is simply mistaken. If anything, we chose a conservative analysis (as is generally the case with papers that I'm involved on; I err on the side of being conservative in my statistics, as Brad Schoenfeld can attest to).
The bottom line is that many of the criticisms of our study do not lie on solid foundations. Certainly, there are limitations to our study. Our results could very well be due to random chance, and 5 other studies with similar designs could get published showing opposite results. As always, science is a process of accumulating data through experiments and observation, and conclusions are always tentative. Our conclusion is that there is a dose-response relationship between set volume and hypertrophy, including volumes higher than previously believed would be beneficial, but that conclusion is tentative and subject to change based on data as it accumulates.
Nice Article Thanks for share this .
Hey James, Thank you for taking the time to do this. I had a question about ANCOVA. While I have a decent math background, it is very rusty. I have however asked those with statistics degrees for clarification. None were quite as sure handed on this as you or Brad. I think it’s worth pointing out sources like Wikipedia (many people’s first go-to), as well as papers like this: http://www.bwgriffin.com/gsu/courses/edur8132/notes/Miller_Chapman_ANCOVA_Abuses.pdf mention there is no lack of controversy around using ANCOVA for adjusting for baselines. Despite its common usage. Specifically to the paper, what I’ve been having a hard time wrapping… Read more »
Hi James, I think your response in the above article is very solid, objective and rational. Looking at the charts you posted, and assuming that each circle ⭕️ represents an individual result from the study, I am personally drawn to the large variation in responses displayed in the graphs. To me, it seems you have small sample sizes and quite a degree of spread in the “dosage” results. Not surprising at all. If I am interpreting the chart results correctly, there are individual examples of both high and low responsiveness across each of the conditions. With such small sample sizes,… Read more »
Hi, Paul,
Thank you for your positive feedback!
Yes, each circle represents an individual result, and you are correct that there is large variation in the response. And yes, they are individual examples of both high and low responsiveness across each of the conditions.
Thanks again for allowing your knowledge and research to reach the general public and then spending the time to educate the people that don’t really get stats. I am sorry that you have had to deal with the haters. Your work has truly helped me reach my goals and I cant thank you enough.
Thank you Laurence!