Why Do Resistance Training Studies Differ In Their Findings? A Lesson in Sampling Variance
In the critiques that have been levied against our recent study on the effects of volume on hypertrophy, I have noticed a critical error of some individuals (like Lyle McDonald) when comparing the results of our study to that of other studies. Essentially, these individuals place way too much emphasis on the outcomes of individual studies, and fail to understand that you can get different results from different volume studies based on random chance alone. This is especially true when you have studies with small sample sizes, and you're measuring something that has a large amount of variation in how people respond (in this case, hypertrophy).
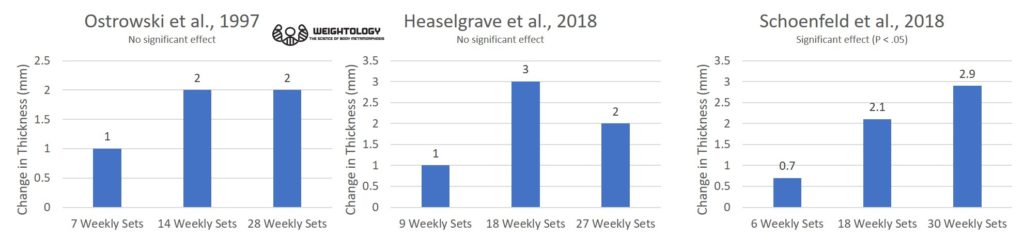
The criticisms go something like this. Individuals will point out that, in the study by Ostrowski and colleagues, the percentage gain in triceps thickness for the group doing 28 weekly sets was not much different from the group doing 14 weekly sets (there was no statistically significant effect between any of the groups). They will also point out that, in the recent study by Heaselgrave and colleagues, the percentage gains in bicep thickness was lower with 27 weekly sets compared to 18, suggesting a decrease in response due to overtraining (although it should be noted there was no statistically significant difference between the groups). These studies are taken as evidence that there is no benefit beyond a weekly volume of 20 sets, and thus the results of our recent volume study must be invalid.
Here's a graphical representation of the results of these three papers. I'm using the biceps thickness data from our paper so that it's at least comparable to the Heaselgrave paper. You can see how the pattern, when looking at the raw means, varies between the three studies. The results were statistically significant only in our volume study.
So how can three studies, using similar weekly volumes for each level and similar subjects (young, college-aged resistance trained males), show such different patterns? First, differences in study design can play a role, such as differences in exercise selection, subject experience, training frequency, etc. However, you can get different patterns like this even when study designs are identical.
Would you believe that all three of these studies are consistent with a graded dose-response relationship? Even though only one of the studies shows a clear dose-response all the way to the highest volume?
"What?" you ask. "How can that be?"
The answer is due to something called sampling variance.
A Lesson in Sampling Variance
Imagine that there are 3 million college-aged resistance trained males in the world (I'm making numbers up here for illustration purposes). One million do low volume training, one million do medium volume training, and one million do high volume training. These are the populations that we're studying.
Now, it would be ideal to test all 3 million people to get the true effects of volume on hypertrophy. Unfortunately, that's impossible. Thus, we take a random sample of each group and look at how they respond to training. However, these random samples will not perfectly mirror what happens in the entire population. There will be some random variation in how they respond; we call this sampling variance.
The size of my samples will impact the amount of sampling variance. If I take two random samples of 500,000 people from my million population, those samples will very closely mirror what happens in the entire population. But if I take two random samples of 10 people from my million population, the response of those samples may deviate significantly from what happens in the entire population, just due to random chance.
Let's say that there is a true dose-response effect of training volume on biceps thickness. The group of one million people performing low volume training increases their biceps thickness by an average of 1 mm. The group performing medium volume training increases their biceps thickness by 2 mm. The group performing high volume training increases their biceps thickness by 3 mm. Thus, the highest volume has 3 times the hypertrophy of the low volume.
But what happens if we take random samples of these populations instead? We can use the rnorm() function in R (a statistical software package) to simulate the drawing of random samples from a normally distributed population with a specific mean and standard deviation. In this case, we'll use means of 1, 2, and 3 to reflect population mean increases of 1, 2, and 3 mm for each level of volume; I've chosen those as those for simplicity and also because they are close to the biceps values observed in our volume study. Let's draw random samples of 10 people, as that's about the sample size used in the three studies I've mentioned (Ostrowski was 9 per group, Heaselgrave was about 16 per group, and Schoenfeld was about 11 per group). We'll use a standard deviation of 2 mm based on within-group biceps change standard deviations I calculated from this study and this study (they were calculated to be about 1.9, so I'm rounding to 2).
Thus, to simulate a sample of 10 people from the low volume population with a population mean of 1 and a standard deviation of 2, we would use rnorm(10, mean=1, sd=2). If we run this function five times, it's like we're running 5 randomly selected groups, all performing low volume training. We can do this with the other volume levels as well.
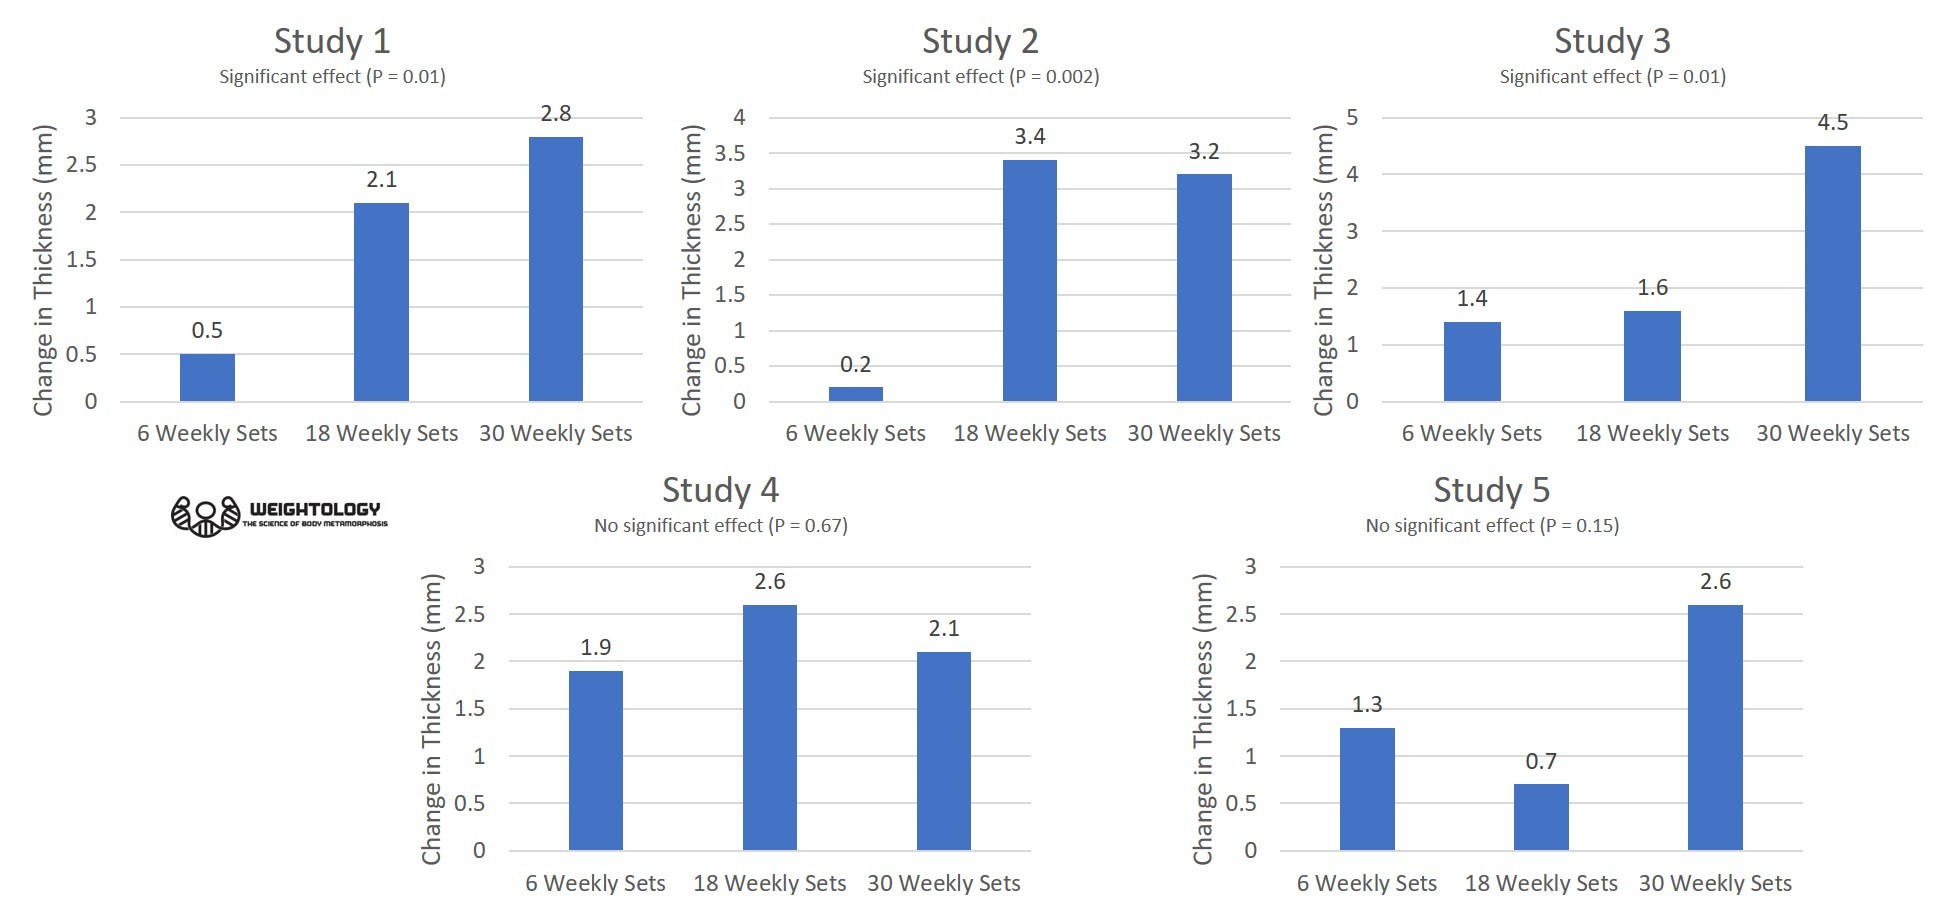
When I simulated only 5 studies in this manner, here's what happened:

You can see that, in only 5 studies, there is widely different patterns of outcomes. Two of the studies do not show any significant differences between groups. Only study 1 shows a graded dose response relationship. Study 2 shows a plateau at the highest volume. Study 3 shows little change going from low to moderate, but then a sudden jump at the highest volume. Study 4 shows a regression at the highest volume. Study 5 shows a random pattern. Yet, the people in these studies have all been randomly drawn from from populations that have a graded dose response relationship all the way to the highest volume (and the highest volume group showing 3 times the hypertrophy of the lowest volume)!
In fact, the patterns observed above are similar to the patterns observed in real-life volume studies examining three levels of volume. The pattern in study 1 is similar to our volume study (graded dose response) as well as the biceps data from Radaelli and colleagues. The pattern in study 2 has similarities to Ostrowski (increase from low to moderate, then a plateau). The pattern in study 3 has similarities to the triceps data from Radaelli (only small changes in the first two levels of volume, and a big change in the highest volume). The pattern in study 4 has similarities to the pattern of Heaselgrave (increase from low to moderate, then a regression).
These simulated studies show different results, yet they are all "right". Their differences are simply due to sampling variance. This is why you should be wary of anyone who claims that a study is invalid or should be thrown out just because the results may not coincide with what you would expect. For example, I've seen Lyle McDonald claim that the Radaelli results should be thrown out because the triceps gains were miniscule in the first two levels of volume (much lower than what is typically observed in other studies), and very high in the highest volume. Yet, you can see in my simulation that you can get odd results just based on sampling variance (and that's ignoring how differences in study design can also contribute). You don't throw out a study just because you don't like the results, or that they don't fit in with some sort of preconceived notion you have about how the results should be.
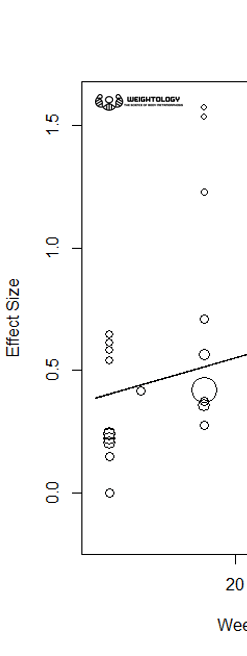
Now, keep in mind that this simulation is based off of identical study designs. In real life, study designs are not identical, meaning that the variance you will see is even higher. Here's a snapshot of effect sizes from three different volume levels (12, 14, and 18 weekly sets) in a meta-regression I performed for subscribers of my Weightology Research Review. These are effect sizes from different studies. You can see the wide variation in effect sizes for the same level of volume; 12 sets results in effect sizes ranging from 0 to about 0.7, and 18 sets results in effect sizes ranging from about 0.3 to over 1.5. Thus, you can see why it's a mistake to look at any study in isolation.
In fact, even looking at a group of studies, without any sort of meta-analysis or meta-regression, can be misleading (and that's what people have been doing in terms of training volume). If you look at the five simulated studies, the results are all over the place. It is very easy to conclude that the graded dose-response relationship in study 1 is a fluke since it's not consistently observed in the other studies. But this is the wrong conclusion; the samples were drawn from populations that show a graded dose-response relationship. The variation you see is nothing more than sampling variance.
This is why meta-analysis and meta-regression are so important. Meta-analysis can give you a better idea of what is happening at a population level. What happens when I do a meta-analysis of all 5 simulated studies, averaging the responses for each group?
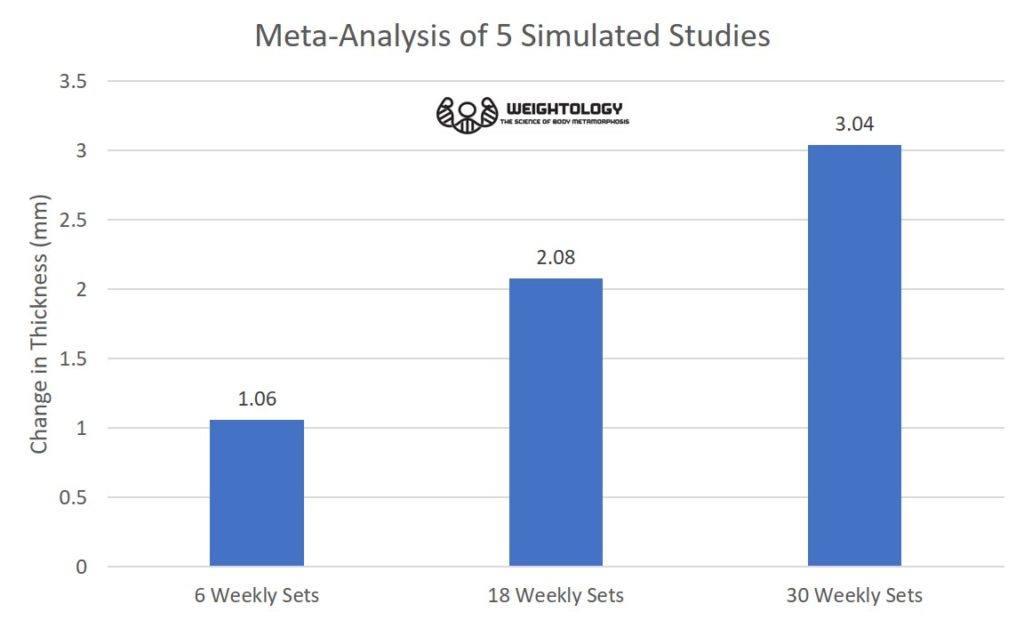
The graded dose-response relationship becomes apparent, and better reflects the population. This demonstrates how meta-analysis is a valuable tool to estimate the true population effects when you have a number of studies with small sample sizes showing different results. I've been keeping an updated meta-analysis on volume and hypertrophy for my research review subscribers, and so far, the graded dose-response relationship has held up as more studies are added. This is not to say it can't change. Conclusions in science are always tentative, and are based upon the available data and the weight of the evidence. The weight of the evidence can change as more studies are performed. There is still a fairly small number of studies utilizing high volumes, and thus conclusions of a graded dose-response relationship could change as more studies are completed.
BEWARE CERTAINTY AND THE ISOLATED STUDY
This simulation demonstrates why you can't look at a single study with a small sample in humans and draw any firm conclusions, especially when measuring something like hypertrophy which varies dramatically from one person to the next. Even if you look across a group of studies, it can be misleading in the absence of any formal aggregation of the study results. Thus, be wary when someone places too much emphasis on the results of a single study, or tends to draw conclusions with high levels of certainty based on limited data. Each study is a very small piece of a larger puzzle, a puzzle of which you may not have an idea of what it looks like until you've gathered enough pieces to do so. And even when you do start to get enough pieces, you still only have an idea of what the picture might finally look like. Your conclusion remains tentative. And in science, you almost never have all the pieces of the puzzle. You make an educated guess as to what the puzzle looks like, and change that guess if necessary as you get more pieces.
You have probably heard some self-made expert say that building muscle quickly is not possible and that it can only happen through the use of performance enhancing drugs. But building muscle quickly is easier than most people think; you just need to know some concepts and techniques that can make it happen. Great post!
Thank you!
I agree with everything you said … however: Don‘t you feel it is the researcher‘s responsibility to take these things in account when planning a study?
If, from our history of research, we have a basic knowledge of population variances, we should really make an effort to have appropriately sized samples!
(I realize that it‘s only getting more difficult when multiple groups are compared, and when participants are dropping out, but still!)
Researchers do take this into account when they plan a study. It’s just that sometimes it’s impossible to obtain exactly what you want to do. It is very difficult to enroll a lot of people into a resistance training study. I’m involved in one being carried out right now, and we’re struggling to obtain subjects for it.
I spend years as a trainer frustrated because everyone knew everything about nothing..I tried becoming a physio to ease my frustration…I failed a class and had to withdraw from the program. Getting back into the fitness world now i have a solid understanding of human anatomy physiology and bio mechanics plus a little practical experience. Trainers are desperate to try and get it right and people like brad are simply good at selling fitness…that’s it! Lyle you are in a league of your own! BUT they have more sex appeal and you can’t change. If what they did was even… Read more »
people like brad are simply good at selling fitness…that’s it! Brad has contributed numerous scientific publications to the literature, including the impacts of light versus heavy training and the impacts of rest intervals which had received very little study. Most of Brad’s work has nothing to do with selling fitness. Lyle you are in a league of your own! Perhaps in his unacceptable behavior towards others. But in terms of knowledge, there’s plenty of individuals who are just as knowledgeable, if not more knowledgeable, and do not treat people the way he does. If what they did was even close… Read more »