
How Much Do Variations In Physiological Testosterone Matter To Your Gains?
Key Takeaways
- Cross-sectional data, dose-response studies, and TRT studies all support variations within the normal range as having an impact on fat-free mass and muscle.
- Variations in your blood levels of testosterone impact your "base" level of muscle, but has minimal impact on your relative (%) gains.
- The impacts of testosterone and resistance training on fat free mass and muscle are mainly additive rather than synergistic.
- Baseline fat-free mass increases by approximately 0.7 - 1.3 lb or 0.3 - 0.6 kg for every 100 ng/dL increase in physiological testosterone. This is based on averages and between-subject data, so individual outcomes may vary considerably.
- Variations in testosterone in women, within the normal physiological range, have very little, if any, measurable impact on muscle.
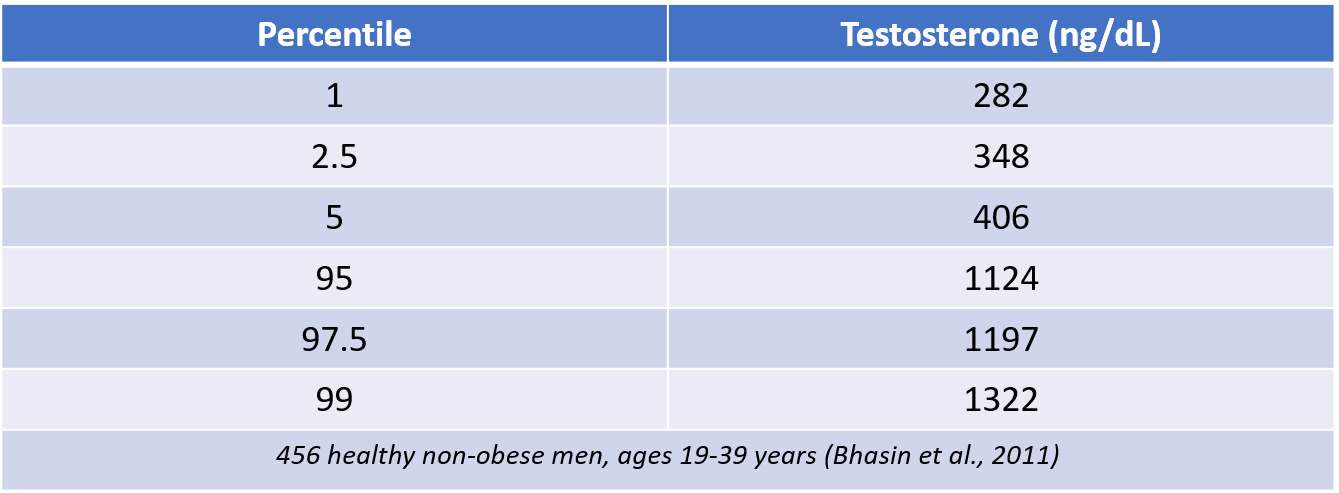
It is well established that anabolic steroid use, which involve supraphysiological doses of testosterone or related hormones, causes massive increases in muscle size, well beyond what can be obtained naturally. However, while supraphysiological doses of testosterone and testosterone derivatives will significantly enhance your gains, this doesn't tell us whether variations in testosterone within a normal physiological range can have any impact. There is quite a range of blood levels of testosterone from one man to the next. For example, in this study of 456 healthy, non-obese men between 19 and 39 years of age, here's the range of blood testosterone concentrations (measured in the morning after an overnight fast).
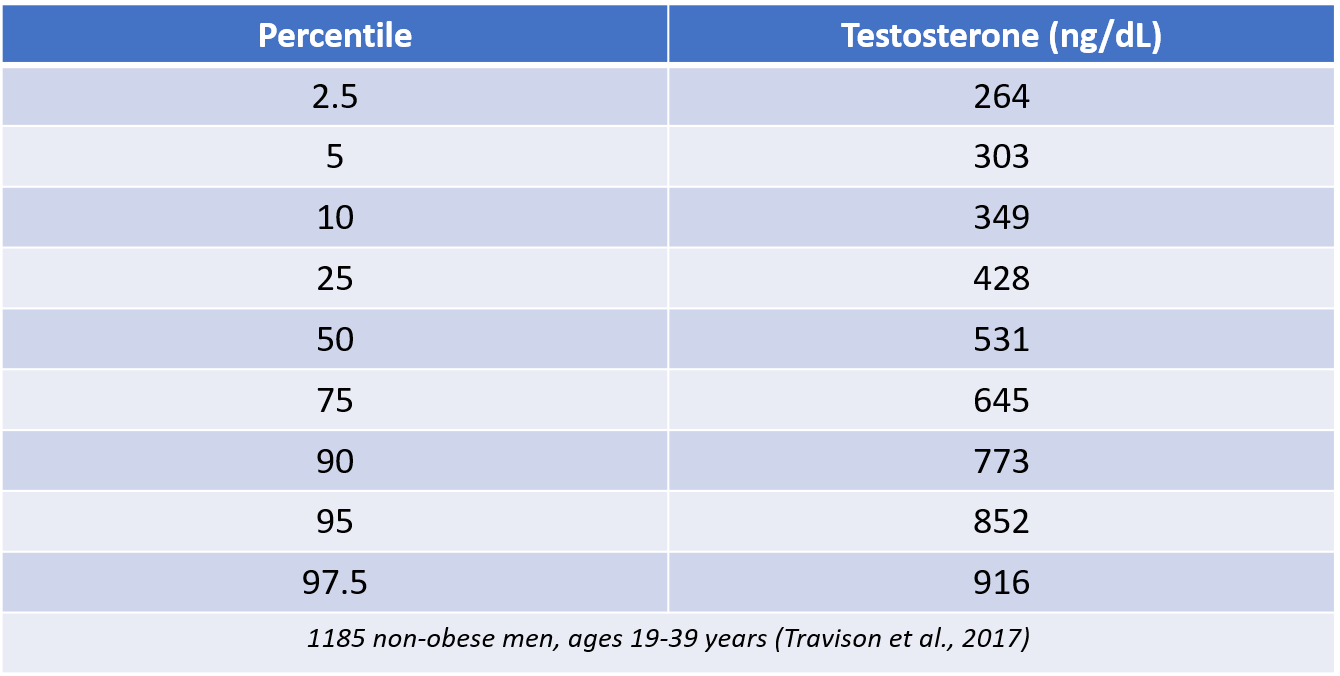
The above study was performed on a sample of individuals from the Framingham Heart Study Generation 3. However, ranges of testosterone concentration can vary depending upon the population, and the assay used to measure testosterone. Labs also vary a lot in their reference ranges. Travison and colleagues took data from four major cohort studies, and used statistical models to establish reference ranges that could be applied across different laboratories. Here was the range of blood testosterone concentrations they established.
Regardless of the reference range that is used, there is no doubt that there is wide variance in testosterone levels among men, even among men that are healthy and non-obese (as obesity is associated with lower testosterone). This brings up the question of whether variations in a normal range can impact muscle gains. Does a man with naturally higher levels of testosterone build more muscle than a man with lower levels, even if both men are in a normal range? The answer to this question can have particular relevance to aging men. Testosterone declines with age. For example, here's data from the French Telecom study, showing declines in testosterone across all percentiles as men age.

Percentiles of plasma testosterone distribution in a sample of 1,408 Caucasian men from the Telecom Study, Paris, France, 1985-1987
Once again, you can see the wide variance in physiological testosterone levels, ranging from 350-400 ng/dL in the 5th percentile to 850-1000 ng/dL in the 95th percentile.
The declines continue into the 60's, 70's, and beyond. Here's data showing mean total testosterone levels across decades of lifespan; this data is taken from six studies.

Total testosterone (ng/ml) by age group (multiply by 100 to get ng/dL); data from 6 different studies
Since muscle mass also decreases with age, and since men with low testosterone show faster rates of muscle loss compared to men with higher levels, we could speculate that older men might benefit from bringing testosterone into the mid to upper physiological range.
Thus, all of this data brings up a number of important questions:
- Do baseline testosterone levels correlate with the training response?
- Does extremely low testosterone impair muscle mass and muscle gains?
- Do variations within the normal physiological range impact muscle mass?
- If testosterone levels are low or borderline low, does bringing levels up to the mid or upper range help improve muscle mass?
- If variations in the normal physiological range have an impact on muscle in men, does it also have the same impact in women?
Let's take a look at the research to help us answer these questions.
Do Baseline Testosterone Levels Correlate With The Training Response?
One way to examine whether there is a relationship between testosterone and muscle gains is to look at the training responses of a set of individuals, and see if baseline testosterone levels are related to how much muscle each person gains. McCall and colleagues found no correlation between baseline testosterone levels and changes in muscle size in recreationally trained young men. However, Ahtiainen et al. found a strong correlation between baseline testosterone levels and improvement in maximal isometric force over 21 weeks. The correlation with hypertrophy was not addressed.
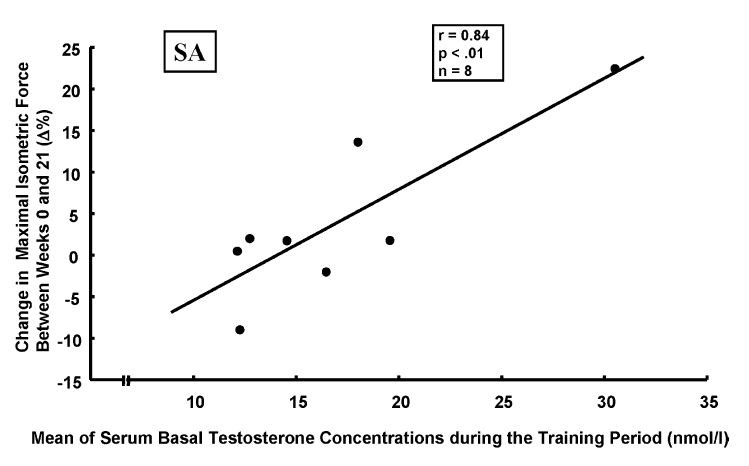
Given the relationship between hypertrophy and isometric force production, we might speculate that there was a relationship between baseline testosterone and hypertrophy in this study, but we cannot know for certain.
In a study by Bhasin and colleagues, HIV-infected men with low testosterone (<349 ng/dL) were randomly assigned to placebo, resistance training only, testosterone injections only, or combined testosterone and training. Baseline testosterone levels did not correlate with change in fat-free mass (FFM), and there were no significant differences in absolute FFM gain between men who had testosterone levels <275 ng/dL, and men who had levels 275-350 ng/dL.
We can also compare muscle gains between males and females, since men have 10 times as much testosterone as women. If baseline testosterone levels correlated with the training response, we would expect men to have greater gains than women. However, when men and women are put on resistance training programs, while the absolute gains in muscle are greater in men, the relative gains in muscle (i.e., the percentage gains) are mostly similar.
Overall, this limited data would suggest that testosterone levels don't really impact gains. However, this is cross-sectional data, and it's not really designed to address the question of whether variations in physiological testosterone impact your gains. Therefore, we need to look at some research where testosterone levels are directly manipulated.
Does Extremely Low Testosterone Impair Muscle Mass & Muscle Gains?
One way to examine the impact of testosterone on muscle gains is to see what happens when you suppress testosterone production. Mauras et al. gave young men Lupron, a drug that suppresses natural testosterone production. Testosterone levels dropped from 535 ng/dL to 31 ng/dL after 10 weeks. Thus, the mean receiving Lupron had levels of testosterone similar to a woman. Fat-free mass decreased by 2.1 kg, and whole body protein synthesis decreased by 13%.
Of course, there was no training in this study. Perhaps weight training might interact with this response. Kvorning and colleagues gave young men goserelin, which suppresses natural testosterone production, or a placebo. The men, who had minimal resistance training experience, engaged in an 8-week strength training program. Testosterone levels fell from 651 ng/dL to 57 ng/dL, and then 31 ng/dL in the group receiving goserelin. Suppression of testosterone did not impair improvements in 10-RM performance compared to the placebo. However, improvements in isometric strength were significantly lower with goserelin. Improvements in leg lean mass were significantly less for goserelin, and total lean body mass also tended towards that direction (P value of 0.07, where 0.05 is considered significant). The mean gain in lean body mass was 1 kg greater in the placebo group compared to goserelin. The difference in lean leg mass was 0.2 kg.
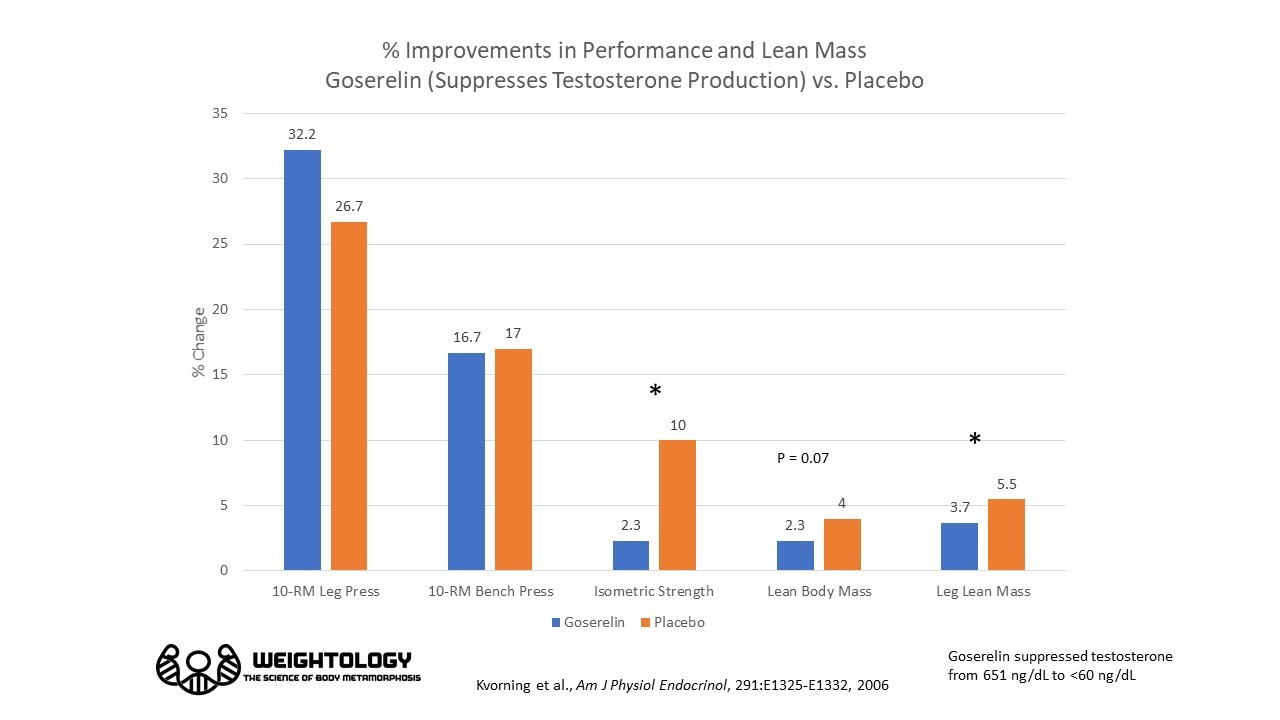
Thus, this study showed that suppression of testosterone production did impair lean mass gains, but the difference was not large, amounting to about a 1 kg overall difference in lean mass gains over 8 weeks. Direct measurements of muscle size were not performed, although the big differences in isometric strength gains likely indicate muscle gains were inferior with testosterone suppression. Thus, this data would suggest that there is an impact of testosterone on muscle gain, but it's small.
Do Variations Within the Normal Physiological Range Impact Muscle Mass?
None of the research discussed so far can really tell us whether variations within the normal physiological range can impact muscle mass. There are three ways in which you could answer this question. The first way is by looking at cross-sectional data. This is where you take large groups of men, and divide them into categories based on their testosterone levels. You then look at whether muscle mass differs between men in different categories, or you look at whether testosterone levels correlate with muscle mass levels. Let's look at these studies.
- He et al. examined 270 sedentary men from the HERITAGE Family Study. After controlling for age and ancestry, testosterone was not correlated with fat-free mass. Interestingly, though, it was negatively correlated with fat-free mass index (FFM divided by height squared, similar to BMI), meaning people with a higher FFM index had lower levels of testosterone. Does this mean having more testosterone actually means less muscle? Not so fast! This data is confounded by the fact that some of the men were obese, and higher BMI's and higher body fat percentages were associated with lower testosterone. Here's the testosterone levels by quartiles of BMI; you can see that testosterone levels drop as BMI increases.
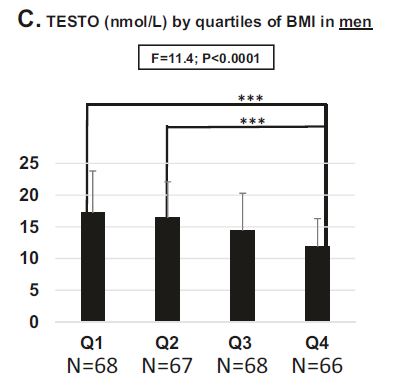
Testosterone by quartiles of BMI in men. 1 nmol/L = 0.0347 ng/dL
Because obese men also have more FFM, this will make it appear like there's a negative relationship between FFM and testosterone levels. What we need is research looking at the relationship in non-obese individuals.
- Van Den Beld et al. found no relationship between testosterone and lean body mass in elderly men (age 73-94 years).
- Mouser and colleagues collected testosterone and body composition data from 252 men in the 1999-2000 National Health And Nutrition Examination Survey (NHANES) between the ages of 18 and 85. Men who fell outside the normal range for testosterone (240 to 950 ng/dL) were not included in the analysis. The men were separated into quartiles based on their testosterone levels. The men showed progressively higher amounts of lean body mass in the lower body with increasing testosterone levels, even after adjusting for age, race, presence of diabetes, self-reported participation in physical activity, C-reactive protein, and dietary protein intake. Quartiles 3 and 4 were statistically significant compared to quartile 1. A somewhat similar pattern emerged for the upper body, although there was no difference between quartile 3 and 4.
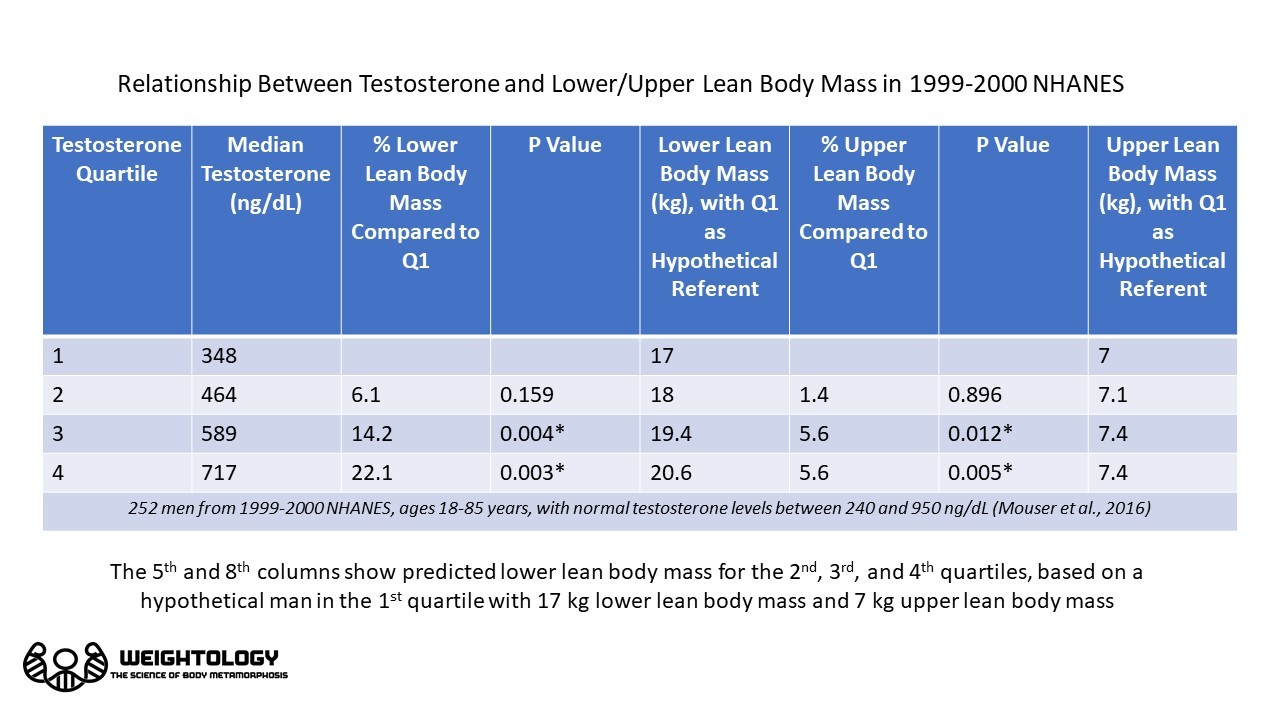
This data showed that men in the 3rd quartile had 14.2% more lower lean mass and 5.6% more upper lean mass compared to men in the 1st quartile. Men in the 4th quartile had 22.1% more lower lean mass and 5.6% more upper lean mass compared to men in the 1st quartile. If we took a hypothetical man in the 1st quartile with 17 kg of lower lean mass, a man in the 3rd quartile would be predicted to have 19.4 kg, and a man in the 4th quartile would be predicted to have 20.6 kg. Thus, this data showed men in the higher end of the physiological range of testosterone had more lean body mass than men in the lower end, even when accounting for other variables that might affect testosterone.
The Mouser cross-sectional data indicates there potentially is a relationship between testosterone levels in the physiological range and how much lean mass you have. However, one problem with cross-sectional data is that it can't establish cause and effect. Another way we can address the question of whether variations within a physiological range impact muscle mass is to suppress natural testosterone production using drugs, and then give different doses of testosterone and see if there's a dose-response effect. There are four studies that have done this.
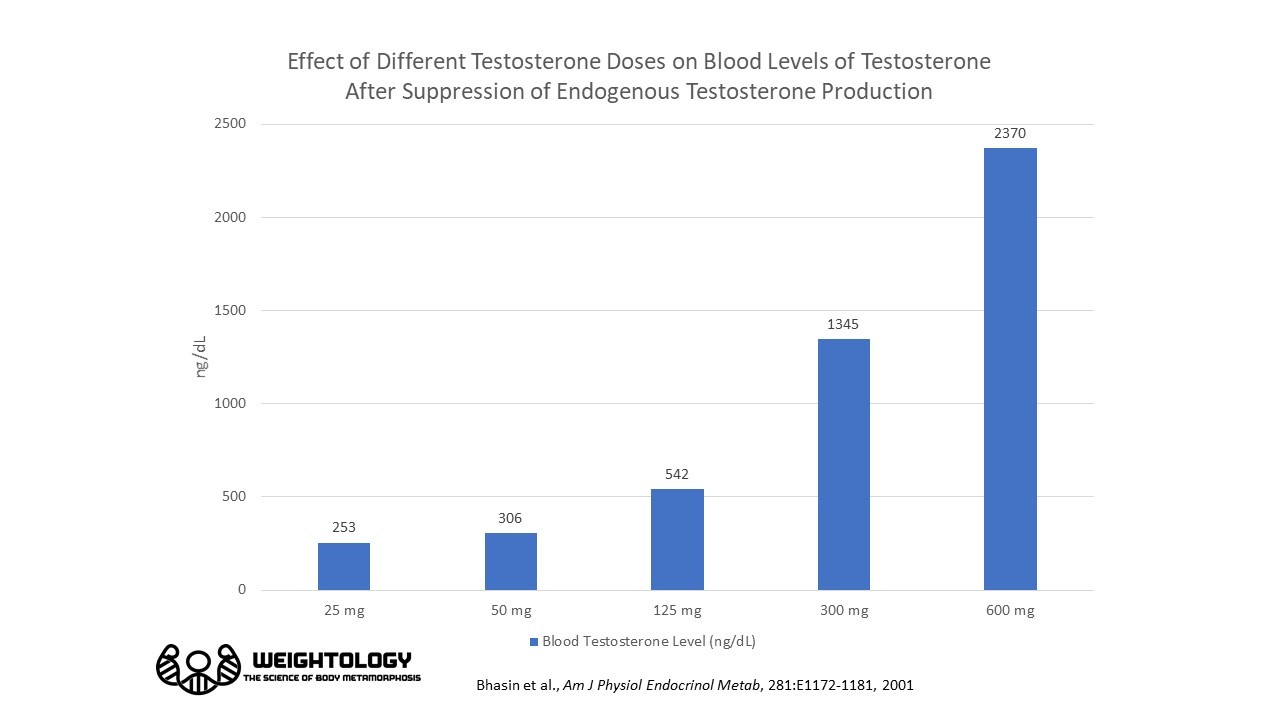
- Shalendar Bhasin and colleagues gave healthy young men a gonadotropin-releasing hormone (GnRH) agonist to suppress endogenous testosterone secretion. They then gave the men weekly injections of 25, 50, 125, 300, or 600 mg of testosterone enathnate for 20 weeks. Here's the average blood levels of testosterone for the different doses; blood levels increased with increasing doses, and the 300 and 600 mg doses resulted in testosterone levels above the normal physiological range.
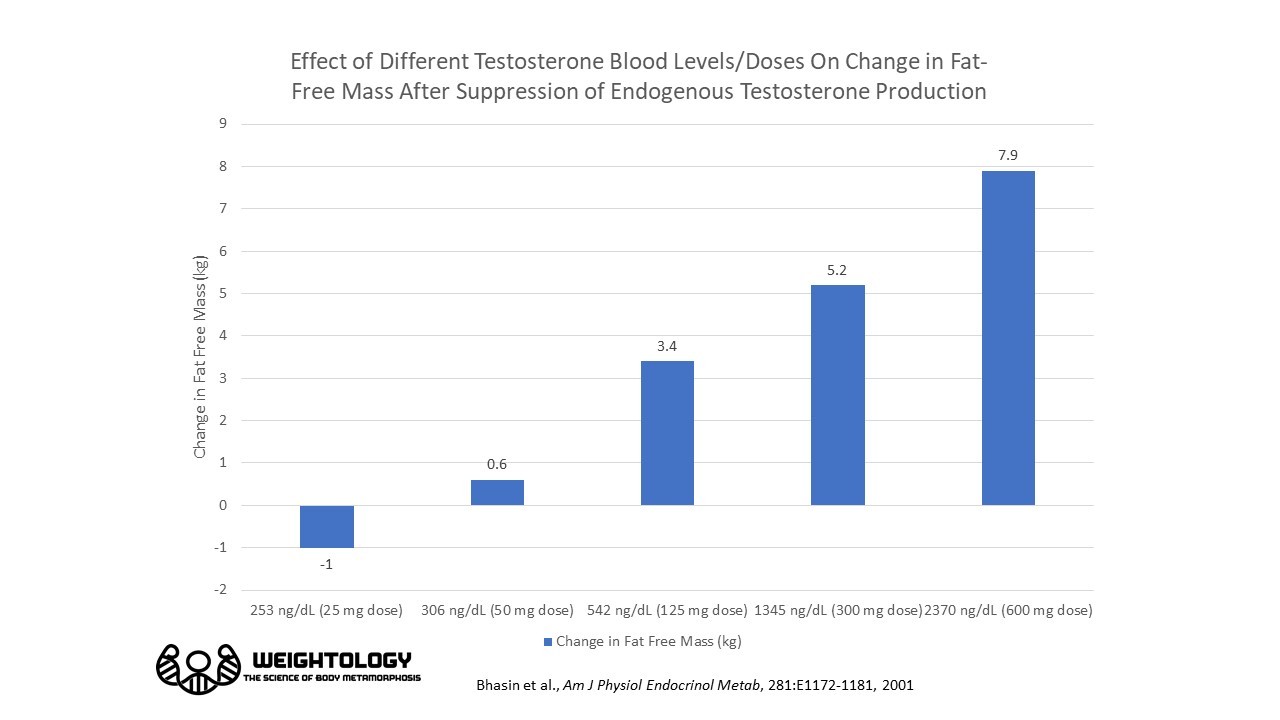
There was a dose-dependent increase in fat-free mass; greater blood levels of testosterone resulted in greater increases in FFM.
Thigh muscle volume also increased in a dose-dependent fashion.

Change in fat-free mass and change in quadriceps muscle volume were significantly correlated with blood levels of testosterone.
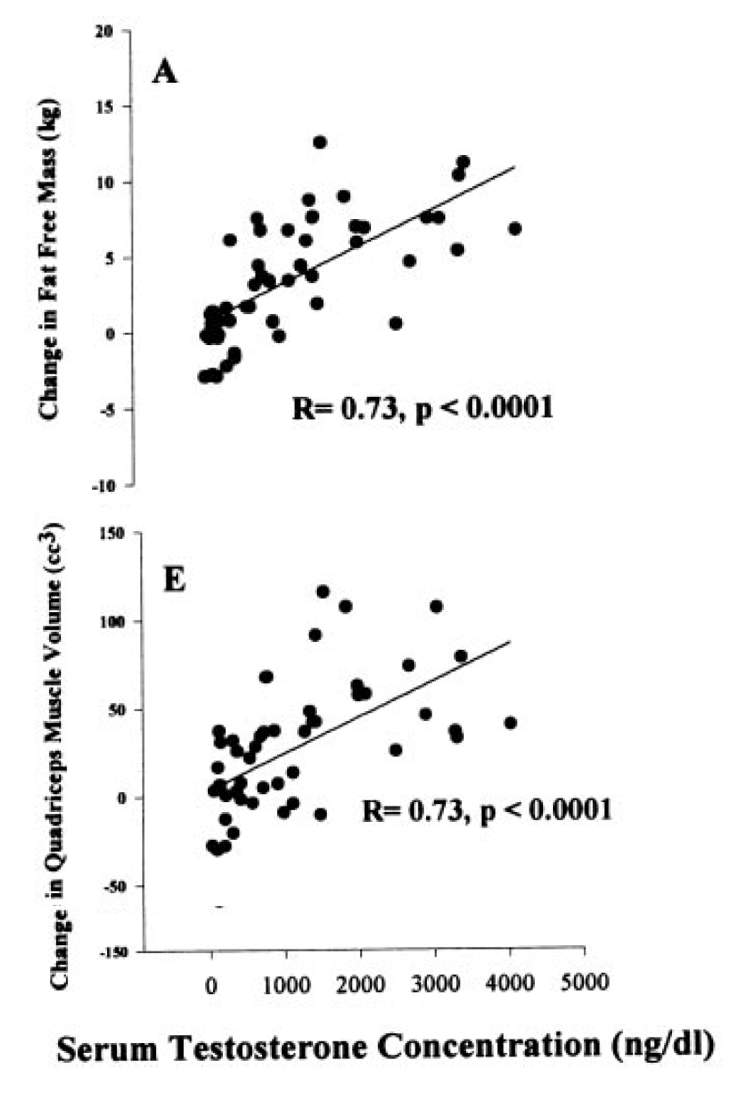
Overall, this study showed a dose-response effect of testosterone on muscle size, even within the physiological range. In fact, just going from the low end of physiological (306 ng/dL) to the mid-range (542 ng/dL) resulted in an increase in fat-free mass of 2.8 kg.
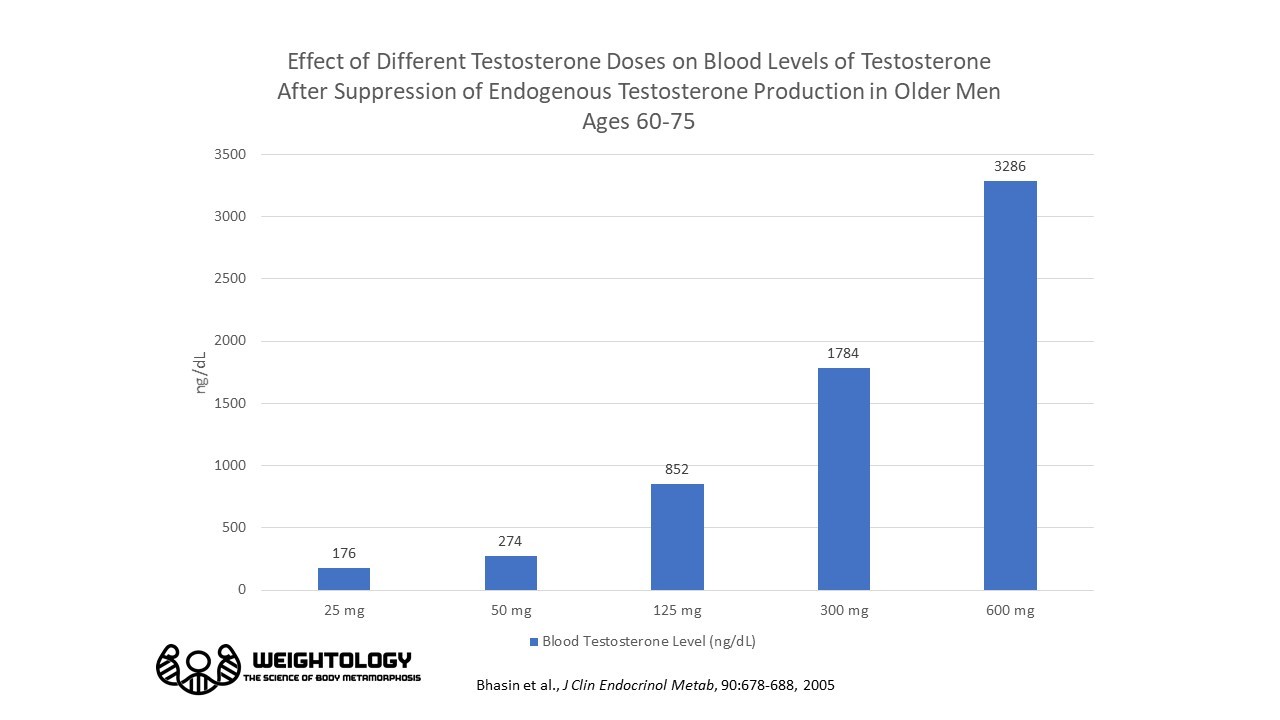
- Bhasin repeated the same experiment in older men between the ages of 60 and 75. Outcomes were very similar; the following charts show the dose-response effects in the older men.

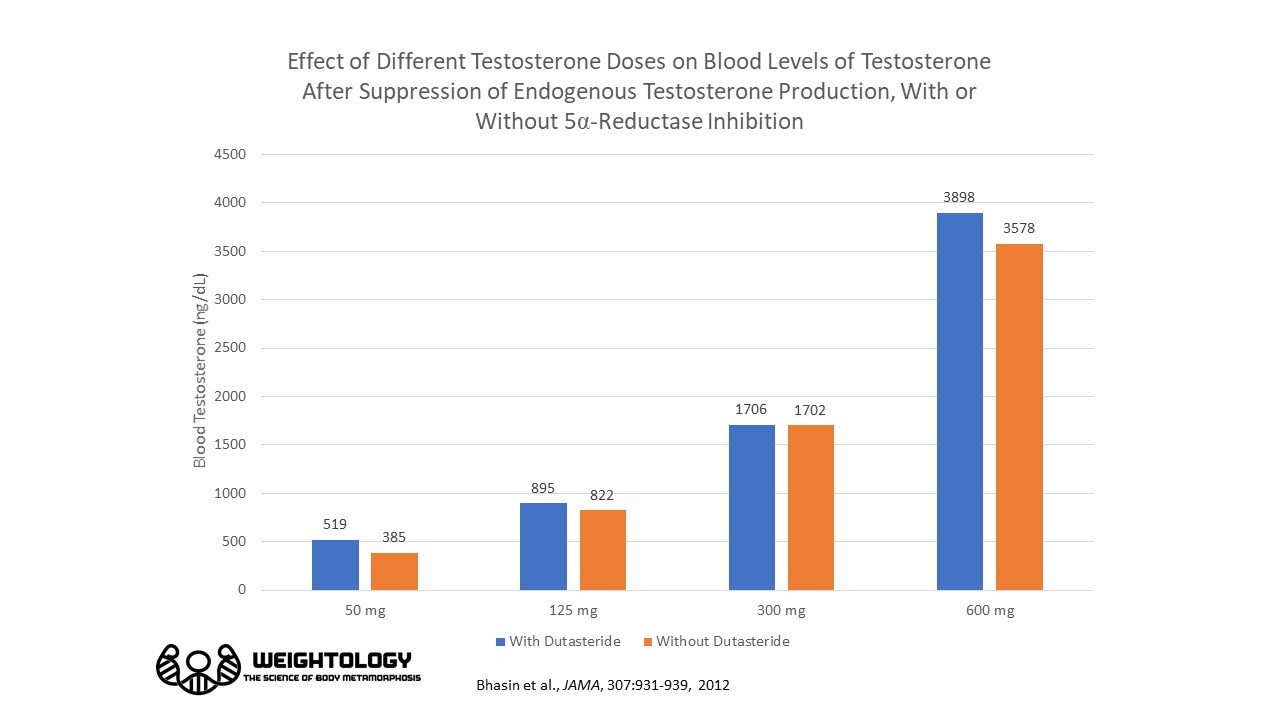
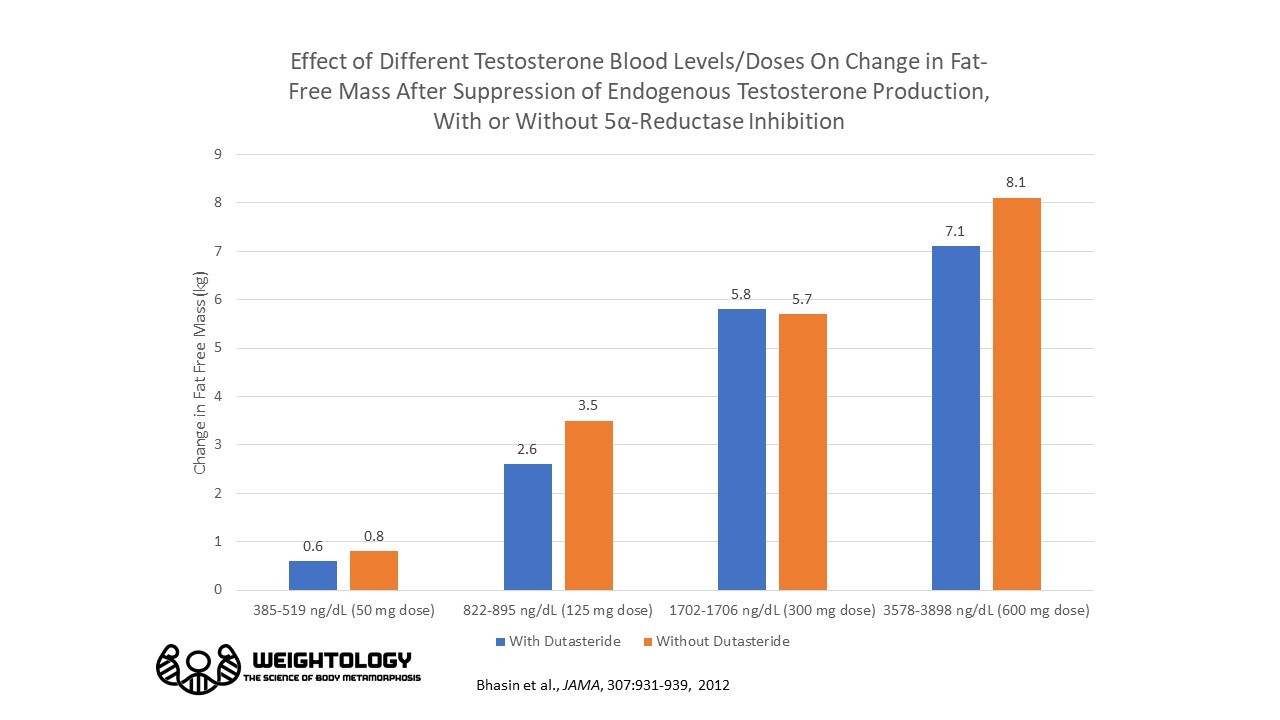
- A third study by Shalendar Bhasin involved a similar design. Natural testosterone secretion was suppressed using Lupron in healthy men between the ages of 18 and 50. The men were then given 50, 125, 300, or 600 mg/week doses of testosterone enathnate, with or without a 5α-reductase inhibitor (a drug that blocks the conversion of testosterone to dihydrotestosterone or DHT). Results again were similar, with greater fat-free mass as blood levels of testosterone increased.
- Finkelstein and colleagues provided 198 healthy men 20 to 50 years of age with goserelin to suppress their testosterone levels. They were then randomly assigned to receive a placebo gel, or 1.25 grams, 2.5 grams, 5 grams, or 10 grams of a testosterone gel daily for 16 weeks. Another 202 men were subjected to the same protocol, except they were also given an aromatase inhibitor (anastrozole) to suppress the conversion of testosterone to estrogen. There was a dose-response effect of the different testosterone doses on blood testosterone levels., ranging from below the physiological normal range for the 0 and 1.25 gram doses, to the high end of the physiological range for the 10 gram dose. The blue bars represent the group that did not get anastrozole, while the red bars represent the group that did receive it.
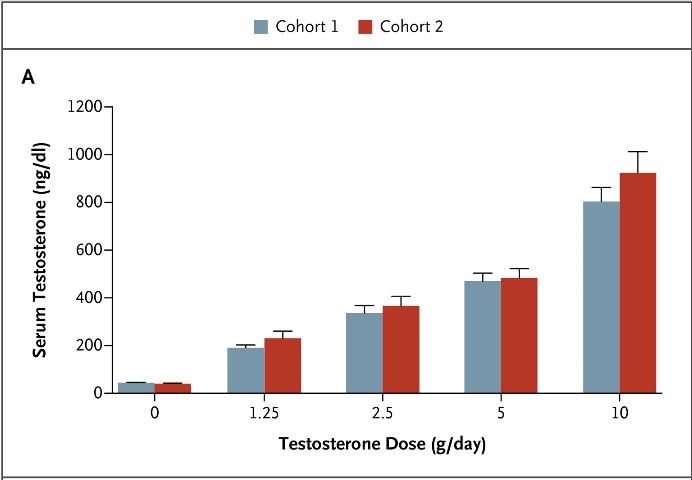
Blood testosterone levels with different doses of a testosterone gel, after suppression of endogenous testosterone with goserelin. The red bars represent a group that received anastrozole, an aromatase inhibitor, to reduce the conversion of testosterone to estrogen. Data from Finkelstein et al., NEJM, 2013
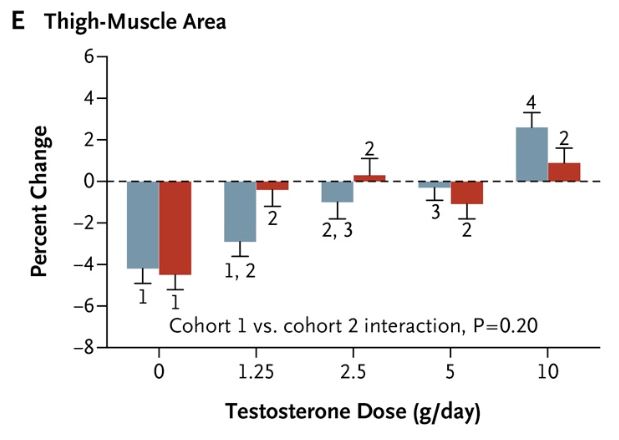
Changes in lean mass and thigh muscle area showed somewhat of a dose response effect, although not as clear of a trend as the papers by Bhasin that involved injections. No testosterone resulted in the largest loss of lean mass, while the highest dose resulted in the largest gain, although much of the differences were not statistically significant. Numbers that are the same indicate no statistically significant different from other bars.

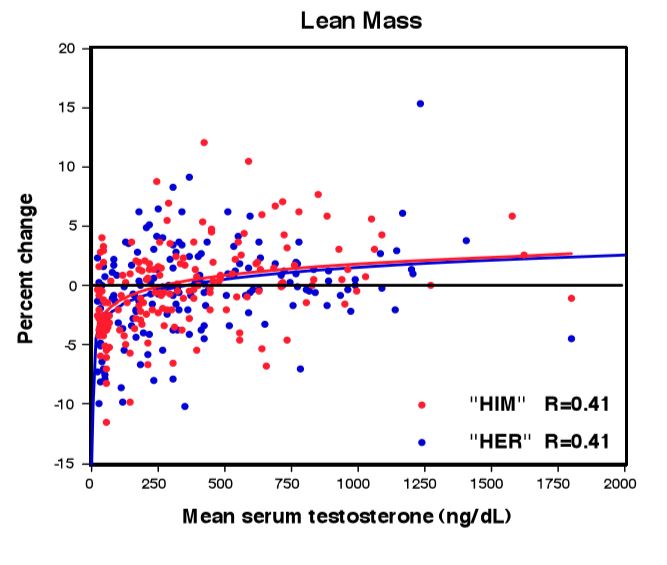
There was a huge amount of variance in how individuals responded to testosterone, as can be seen in this scatterplot.
 A third way to examine whether variations in a physiological range impact muscle gains is to look at whether pushing testosterone to the very upper limit of the normal range (such as what occurs in testosterone male contraceptive studies) impacts lean mass. Herbst et al. studied the impacts of exogenous testosterone (100 mg testosterone enathnate per week) on healthy men with normal testosterone levels. Testosterone levels increased from 570 ng/dL to 734 ng/dL (the level right before the next injection), with a peak of 1196 ng/dL (24 hours after the injection). Thus, the peak level was at the very upper limit of the normal range, and the trough was in the upper portion of normal. Lean mass increased by 2.5 kg.
Overall, these three bodies of evidence (cross-sectional data, dose-response data, and male contraceptive data) indicate that variations within the physiologically normal range do impact how much fat-free mass you carry. Now, there's a difference here between how much lean mass you carry, and how much you'll gain from a training program (more on this later), but there does appear to be an effect. Which brings us to our next question...
If Testosterone Levels are Low or Borderline Low, Does Bringing Levels Up to the Mid or Upper Range Help Improve Muscle Mass?
What happens if you take people with low testosterone levels, and boost those levels up with testosterone injections? Fortunately there's research to show us.
- Urban and colleagues took 6 healthy, elderly men with an average age of 67 years. Their testosterone levels were 480 ng/dL or less, and they were given testosterone injections for 4 weeks to produce levels similar to those of younger men. Both muscle strength and muscle protein synthesis improved, suggesting that increasing levels within the physiological range may help muscle mass and strength. One limitation is that muscle mass was not directly measured; only muscle protein synthesis and strength were determined.
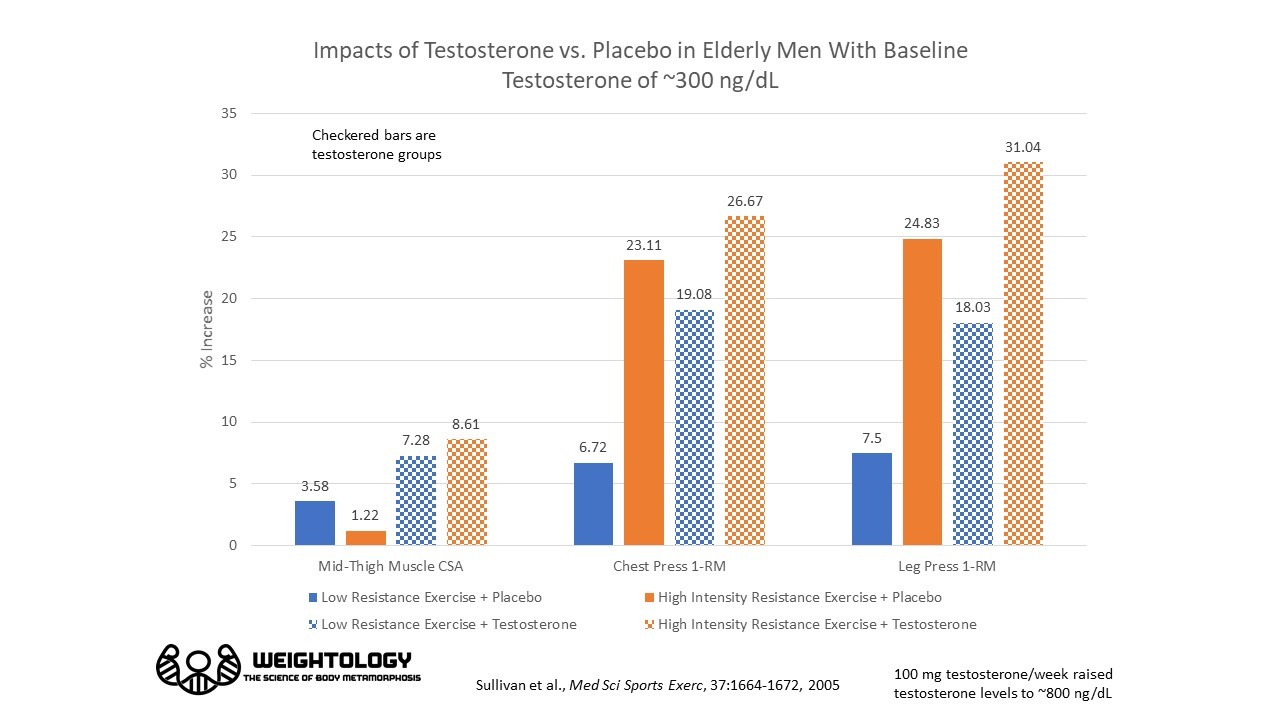
- Sullivan and colleagues took 71 men between the ages of 65 and 93 years old, and randomly assigned them to one of 4 groups:
Low Resistance Exercise (3 x 8 with 20% 1-RM) + Placebo
Low Resistance Exercise + 100 mg/week Testosterone
High-Intensity Resistance Exercise (3 x8 at 80% 1-RM) + Placebo
High-Intensity Resistance Exercise + 100 mg/week Testosterone
The testosterone injections more than doubled testosterone levels compared to placebo, bringing the levels to the high end of normal (804 ng/dL vs. 304 ng/dL). Gains in cross-sectional area of muscles in the mid-thigh was also more than double with testosterone injections versus placebo. Gains in strength were much higher in the low resistance exercise condition when testosterone was given compared to the placebo. However, when the training was high intensity, there was no longer a significant benefit of testosterone, indicating that the training load had a greater impact on strength compared to testosterone in this study.
- Bhasin et al. treated hypogonadal men (ages 19 - 47 years) with 100 mg of testosterone enathnate per week for 10 weeks. Average baseline testosterone levels increased from 72 ng/dL (slightly above the range for an average female) to 767 ng/dL at week 10. Fat-free mass increased by 5 kg, tricep size increased by 12%, and quadricep size increased by 8%.
- Bhasin and colleagues recruited HIV-infected men with low testosterone, and treated them with a topical testosterone cream for 12 weeks. Testosterone levels improved from 258 ng/dL to 367 ng/dL. Fat-free mass increased by 1.4 kg.
- In another study by Dr. Bhasin, HIV-infected men with low testosterone (<349 ng/dL) were randomly assigned to one of 4 groups:
Placebo
Testosterone enathnate (100 mg/week)
Resistance Training
Testosterone + Resistance Training
Testosterone treatment increased blood levels from an average of 201 - 205 ng/dL to 311 - 337 ng/dL. Fat-free mass increased by 4 kg in the testosterone-only group, 2 kg in the training-only group, and 1.6 kg in the training + testosterone group. Thigh muscle volume increased by 40 cm³ in the testosterone-only group, 62 cm³ in the training-only group, and 44 cm³ in the combined group. It is not clear why there was no combined effect in the training + testosterone group.
- Sattler and colleagues gave elderly men (mean age of 71 years) 5 or 10 grams per day of transdermal testosterone (the type you apply to your skin). The men had blood levels of testosterone of 550 ng/dL or less (average concentration was 385 in the 5 g/d group and 350 in the 10 g/d group). Average testosterone concentrations increased by 150 ng/dL in the 5 g/d group (raising levels to approximately 535 ng/dL), and 500 ng/dL in the 10 g group (raising levels to approximately 850 ng/dL). Lean body mass increased by 1 kg in the 5 g/d group, and by 1.6 kg in the 10 g/d group.
- Basaria et al. recruited men with low testosterone (<350 ng/dL) due to opioid abuse, and gave them a daily 5 gram testosterone gel. Average testosterone increased from 243 ng/dL to 790 ng/dL. Fat-free mass increased by 1 kg.
- Storer et al. recruited men older than 59 years with testosterone levels between 100 and 400 ng/dL. The men were given a 7.5 gram testosterone gel or placebo daily for 3 years. Blood testosterone increased from 307 ng/dL to 567 ng/dL in the gel group. Lean body mass increased by 0.7 kg.
- Bhasin and colleagues assigned functionally limited men ages 65 or greater to different levels of protein intake and testosterone or placebo. Average testosterone levels increased from 456 ng/dL to 620 ng/dL. Lean body mass increased by 3.54 kg.
- Brodsky (a fitting name for this study) and colleagues studied testosterone administration in men with testosterone levels less than 200 ng/dL. Testosterone levels gradually increased from 106 ng/dL, to 576 ng/dL at 4 months. to 432 ng/dL at 6 months. These were the lowest concentrations observed before each injection. Injections were given every 2 weeks; the last measured testosterone level was one week after the last injection, and was 1277 ng/dL, just above the physiological range. Fat-free mass increased by 8.7 kg. Mixed muscle protein synthesis increased by 56%, and myofibrillar protein synthesis increased by 46%. Total muscle protein synthesis across the entire body increased by 71-87% (from approximately 2.4 grams per hour to 4.3 grams per hour).
- Snyder et al. gave men with low testosterone (due to disease) a testosterone skin patch for 3 years. Testosterone levels increased from 78 ng/dL to 407 ng/dL. Lean mass increased by 3.1 kg.
- Wang (another fitting name) and colleagues gave men with low testosterone a patch, or one of two different gels (50 mg or 100 mg/day) for 90 days. Testosterone increased from 236 ng/dL to 417 ng/dL in the patch group, 236 ng/dL to 552 ng/dL in the 50 mg gel group, and 248 ng/dL to 791 ng/dL in the 100 mg gel group. Lean body mass increased by 1.2 kg, 1.3 kg, and 2.7 kg in these groups, respectively.
- In another study by Wang, men with low testosterone (<300 ng/dL) were given various doses of testosterone gels for up to 42 months. Total levels increased by approximately 260 ng/dL, and remained in the mid- to lower-normal range for the duration of the study. Lean mass increased by 2.9 kg.
- Tenover recruited men between the ages of 57 and 76, with testosterone levels less than 400 ng/dL, and injected them with 100 mg of testosterone enathnate per week. Average blood levels increased from 334 ng/dL to 568 ng/dL. Lean mass increased by 1.8 kg.
- Snyder and colleagues randomly assigned men over the age of 65 to a testosterone patch or placebo. Testosterone levels increased from 367 ng/dL to 625 ng/dL at 6 months. Lean mass increased by 1.6 kg at 6 months.
- Ferrando et al. recruited men aged 60 years or older and with blood testosterone levels of less than 480 ng/dL, and injected them with testosterone enathnate or placebo on a weekly basis for 6 months. Average baseline level of testosterone was 363 ng/dL. Testosterone injections were individually adjusted to try to maintain a blood level between 490 and 807 ng/dL, although this was not totally successful and many individuals ended up with levels slightly exceeding that target. Average level at 6 months was 882 ng/dL. Lean mass increased by 4.2 kg, while it decreased by 2 kg in the placebo group. Leg muscle volume increased by 488 ml, while it decreased by 96 ml in the placebo group. Testosterone also resulted in an increased in muscle protein net balance, due to a decrease in muscle protein breakdown.
- Dias et al. randomly assigned men between the ages of 65-82 years and testosterone levels <350 ng/dL to a placebo, anastrozole (an aromatase inhibitor), or a testosterone gel. By inhibiting aromatase, the enzyme that converts testosterone to estrogen, you can effectively increase testosterone levels. Anastrozole increased testosterone from 272 ng/dL to approximately 500 ng/dL at 6 months; lean mass increased by 1.5 kg. The testosterone gel increased testosterone from 300 ng/dL to approximately 650 ng/dL, and lean mass did not achieve a statistically significant increase (0.9 kg).
- Magnusson and colleagues randomized type 2 diabetics between the ages of 50 and 70 to a testosterone gel or placebo for 6 months. Testosterone levels increased from 205 ng/dL to 637 ng/dL, and lean mass increased by 1.9 kg.
- Ribeiro and Abucham gave hypogonadal men clomiphene citrate, which increases endogenous (the levels within the body, versus exogenous like from an injection or cream) testosterone by binding to estrogen receptors. By binding to estrogen receptors, it tricks the brain into thinking there's not as much estrogen in the body. This leads the brain to pump out more leuteinizing hormone (LH), which then stimulates the testicles to produce more testosterone. Testosterone levels in responders increased from 201 ng/dL to 435 ng/dL after 3 months, and lean mass increased by 1 kg.
- Liu et al. recruited older men with borderline low testosterone and gave them human chorionic gonadotropin (HCG) injections. HCG stimulates the testicles to produce testosterone. Testosterone increased from 320 ng/dL to approximately 720 ng/dL, and lean mass increased by 2 kg.
- Bayram et al. gave hypogonadal men HCG injections. Testosterone increased from 39 ng/dL (in the range of a female) to 512 ng/dL, an increase of 473 ng/dL. Lean mass increased by 2.8 kg.
- In a study by Casaburi et al., men with COPD and low testosterone (≤400 ng/dL) were randomly assigned to one of 4 groups:
Placebo
Testosterone enathnate (100 mg/week)
Resistance Training
Testosterone + Resistance Training
Testosterone injections increased blood levels from 302 ng/dL in the no-training group to 595 ng/dL, and from 408 ng/dL to 656 ng/dL in the training group. Lean mass increased by 2.3 kg in the testosterone-only group, 0.2 kg in the training only group, and 3.29 kg in the testosterone + training group. It should be noted that training was only performed in the lower body. If we look at leg lean mass gains, they were 1.07 kg in the testosterone only group, 0.49 kg in the training only group, and 1.41 kg in the combined group.
Here's a summary of all of these studies just discussed, where low or borderline low testosterone levels were increased into a physiological range using injections or transdermal delivery systems. You can see they all showed positive impacts on lean mass. Some had relatively small increases in testosterone (such as around 100-250 ng/dL) and showed meaningful increases in lean mass of around 1-2 kg, or around 2-4 lbs. In some of these studies, subjects were in the lower end of the normal range (rather than below the reference range), and even with those subjects, bringing the levels up to the mid to high end of the physiological range had positive benefits.
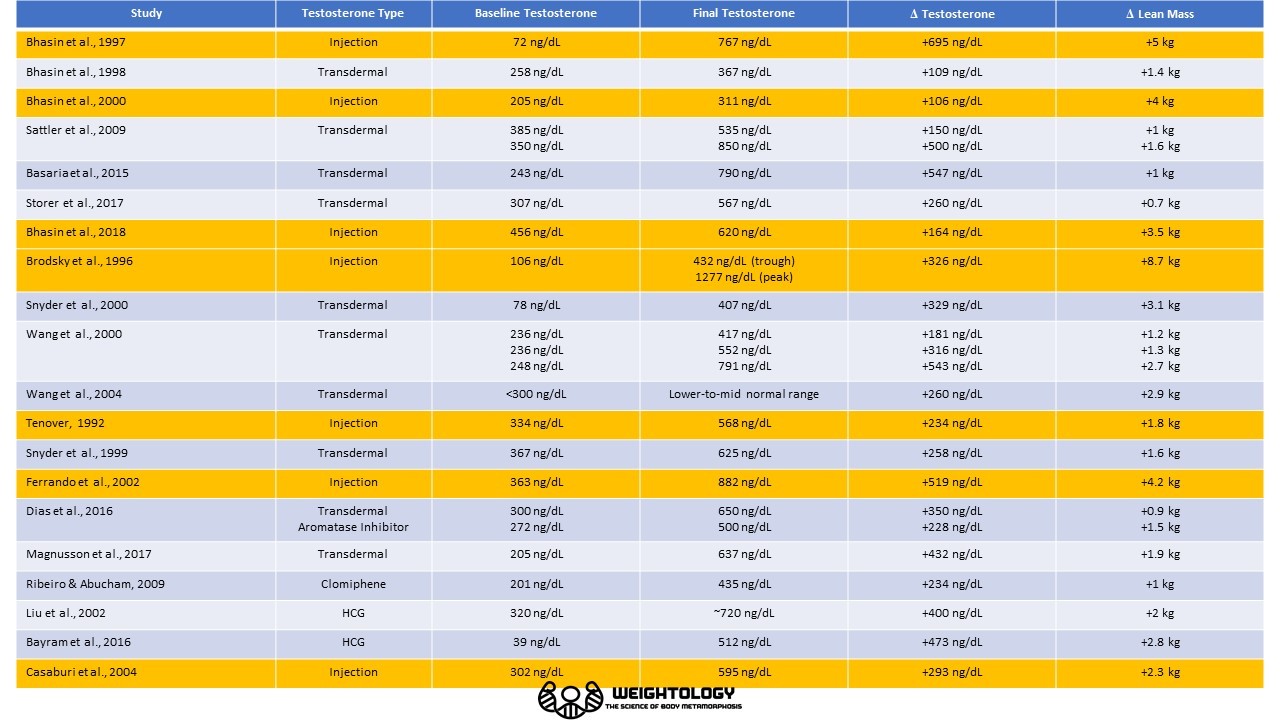
You can see that the lean mass gains with injections (the orange rows) tend to be greater than with transdermal delivery (the gray rows). This is likely because injections cause an initial peak in testosterone that may be in the very upper end of the physiological range, if not slightly exceed the physiological range. Typically, in these studies, testosterone is measured 1-2 weeks after injection, representing the trough or nadir in testosterone levels. Thus, the final testosterone levels do not represent the peak levels achieved. You can see this difference when you look at the study by Brodsky et al, where the peak level, measured at 1 week after injection, was three times higher than the nadir level, measured 2 weeks after injection.
Thus, all of these testosterone replacement therapy (TRT) studies demonstrate a benefit in lean mass from moving below the physiological range, or from the low end of the physiological range, to the mid- or high-physiological range. Thus, it appears that even moving from a low end the physiological range, to the higher end, has a benefit.
Higher Testosterone = Higher Baseline Muscle, Only Slightly Greater Rates of Gain
Overall, the cross-sectional data, the dose-response studies, the male contraceptive studies, and the TRT studies (including ones where baseline testosterone was still normal) show that testosterone variations within the physiological range have an impact on fat-free mass and muscle. Does this mean someone with higher testosterone will gain faster than someone with lower testosterone? Not so fast!
When you look at the body of evidence, the biggest impact of testosterone appears to be on maintenance of a certain baseline level of muscle mass, rather than on the rate of muscle gain. For example, prostate cancer patients are often put on androgen deprivation therapy, where their testosterone levels were suppressed. In this study, average testosterone was 45.7 ng/dL (within the range of a female), compared to 430 ng/dL for controls. Resting and fed-state muscle protein synthesis were lower in the androgen-deprived patients. However, when feeding was combined with resistance training, the muscle protein synthesis response was not statistically different from the controls (although the raw mean was still somewhat lower).
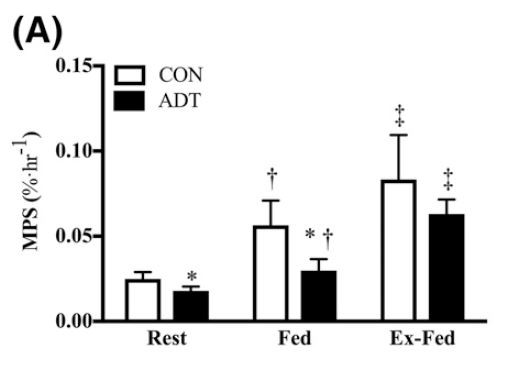
Muscle protein synthesis rates in control subjects vs. patients on androgen deprivation therapy (ADT). Muscle protein synthesis is significantly lower at rest and also after a meal (FED). However, after resistance training, muscle protein synthesis is not significantly different from controls after a meal (EX-FED).
This is also supported when we compare muscle gains between males and females. Men have 10 times as much testosterone as women. They also have greater baseline levels of muscle mass. However, when men and women are put on resistance training programs, while the absolute gains in muscle are greater in men, the relative gains in muscle (i.e., the percentage gains) are mostly similar.
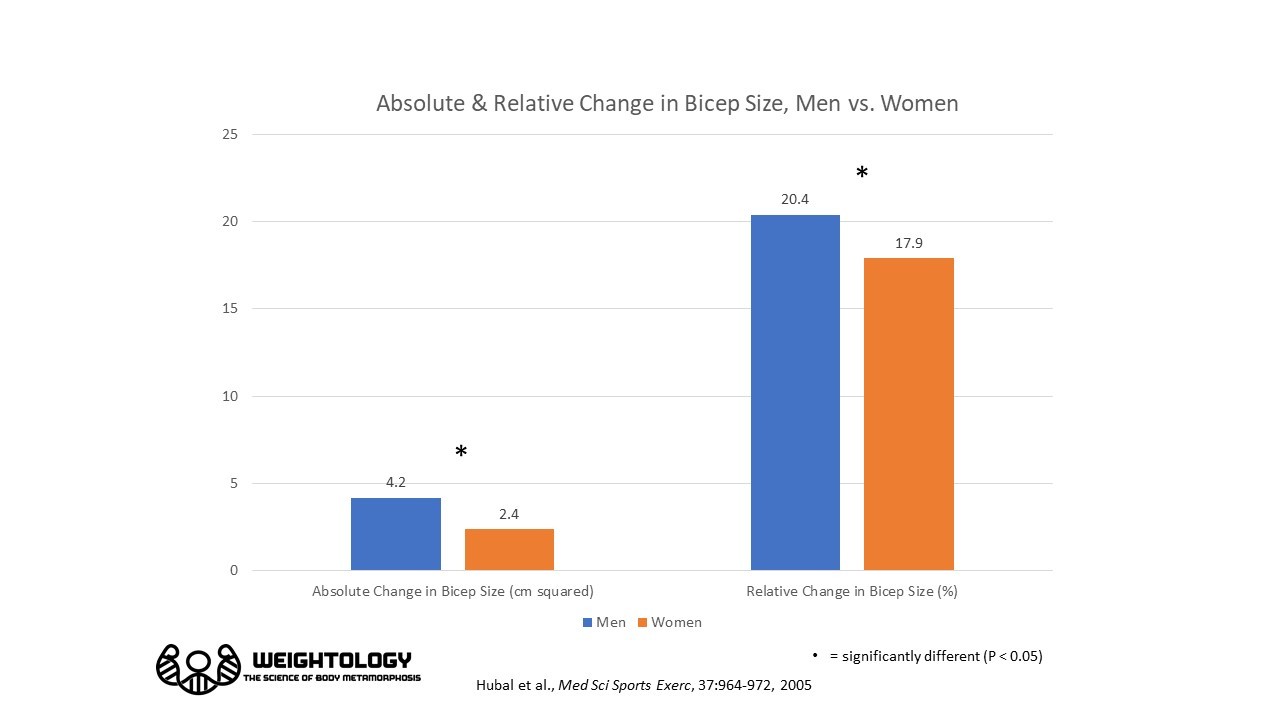
While the percentage gain in the above study was slightly favored in men, it wasn't by much. However, the absolute gain was nearly twice that in men as women. Thus, a 15% gain in muscle size in men will generally be greater on an absolute basis compared to women, since men have a larger baseline.
A third line of support for this concept comes from the famous 1996 Bhasin study on anabolic steroids. In this 10-week study, normal men were randomly assigned to one of four groups:
- Placebo with no training
- Testosterone with no training
- Placebo with resistance training
- Testosterone with resistance training
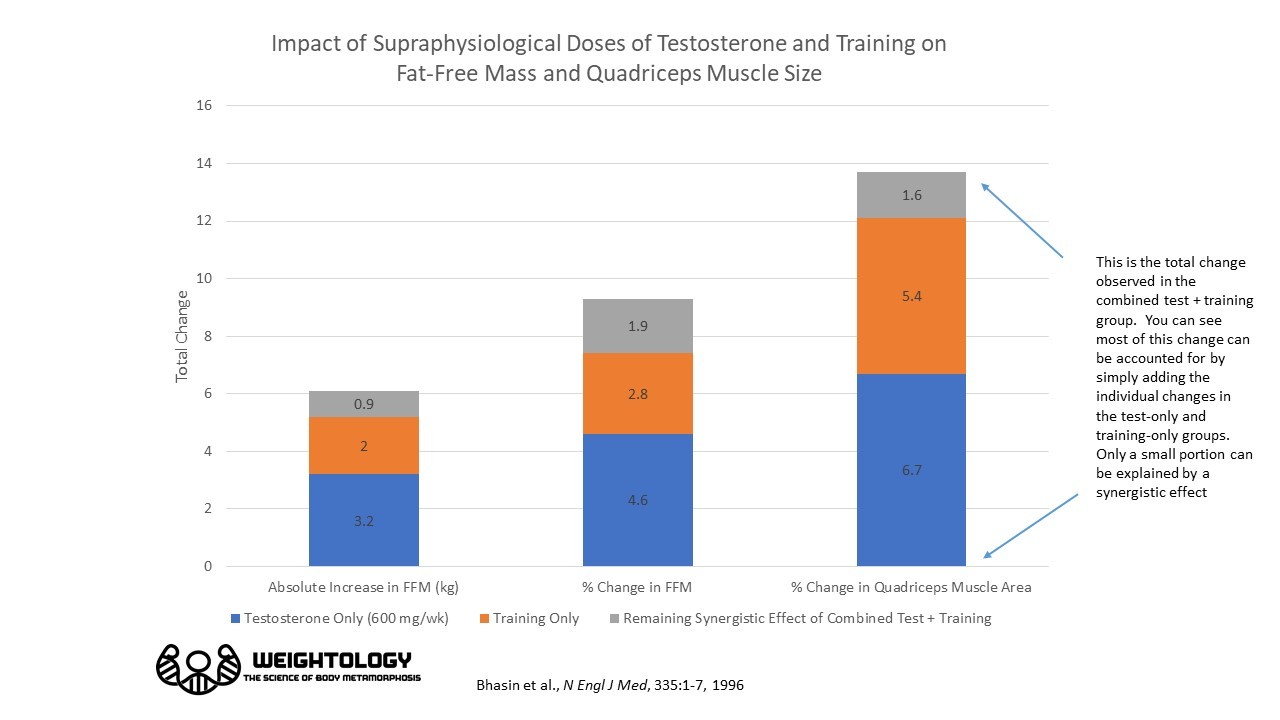
Testosterone was administered in supraphysiological doses (600 mg/week). Testosterone levels were elevated to 2828 - 3244 ng/dL with injections, versus the normal levels of 453 - 667 ng/dL in the placebo group. Testosterone injection, with no training, resulted in an increase in fat-free mass of 3.2 kg. Training alone resulted in an increase in fat-free mass of 2 kg. When training was combined with testosterone injection, fat-free mass gain was 6.1 kg. Quadriceps muscle size increased in a similar fashion in the testosterone + no training group, and the training-only group, while gains were doubled in the testosterone+training group.
The interesting thing here is, when you look at this data, you can see that there was mostly an additive, rather than synergistic, effect of testosterone and training. FFM increased by 3.2 kg with testosterone only. It increased by 2 kg with training only. When you add these two amounts, you get 3.2 + 2 = 5.2 kg, which is reasonably close to the 6.1 kg gain observed in the combined group. In other words, only about 0.9 kg could be explained by a synergistic effect between testosterone and training. You can also see a similar effect for the increase in quadriceps size. The change in quadriceps size was roughly the same in the testosterone-only and training-only groups, and was mostly additive in the combined group. Again, only a small portion of the change in quadriceps size could be explained by a synergistic effect between testosterone and training.
This is similar to the data observed when we look at men and women. The greater testosterone levels in men don't enhance the rate of gains all that much compared to women; it's just that it gives the men a higher baseline to start with, and thus the absolute gains are greater. If there was a strong synergistic effect between testosterone and training, then the relative gains in men would be significantly greater than women, but that's obviously not the case.
A fourth piece of evidence comes from the study by Casaburi and colleagues on men with COPD, which was briefly mentioned earlier. Only leg training was performed in this study. The leg lean mass gains in the combined training+testosterone group was 1.41 kg, which is close to the sum of the gains experienced by the testosterone only group (1.07 kg) and the training only group (0.49 kg). This again suggests the effects of testosterone and resistance training are mostly additive, and not synergistic.
Thus, your testosterone levels affect how much muscle you carry around, whether you train or not. Then, when you begin to train, your responsiveness to training is mostly similar regardless of whether you have low or high testosterone levels. It may be a bit less with lower testosterone, but the biggest impact is on your baseline.
For example, let's say you have a baseline lean mass of 50 kg, and you have a testosterone level in the low end (say around 300 ng/dL). You gain 10% over 6 months, which is 5 kg.
Now, take this same situation, but the person has a baseline testosterone to 600 ng/dL. Your baseline lean mass now may be 52 kg. You still gain 10% over 6 months, which is 5.2 kg. Thus, the relative gain is similar. However, the starting point, and the absolute gain, is larger because of the higher testosterone.
Let's consider another example. Let's say a person goes on some type of testosterone replacement, boosting testosterone from 250 ng/dL to 500 or 600 ng/dL. That person will initially experience some higher-than-normal relative gains, as he moves towards his new baseline for his new testosterone level. It will feel like "newbie" gains. However, once that person has reached his new baseline, his relative gains will be similar to when he had lower testosterone.
Quantifying the Impact of Variations in Physiological Testosterone on Lean Mass
So we know that variations in physiological testosterone do impact how much muscle you have. But just how much? If you go from 300 ng/dL to 600 ng/dL, how much more lean mass can you expect to have?
To answer that question, let's go back to the dose-response studies by Shalendar Bhasin that we discussed earlier. We can take the data from the three studies, and run a regression on them to see how fat-free mass changes with changing testosterone levels within the physiological range.
Here's the regression line for data from Bhasin et al. 2001, 2005, and 2012. I've only used data points where testosterone was within a physiological range, or just outside of it (176 ng/dL to 1345 ng/dL). That's 11 data points. For each 100 ng/dL increase in testosterone, fat-free mass increased by 0.6 kg. The R-squared for the model fit was 0.85, which is very good.
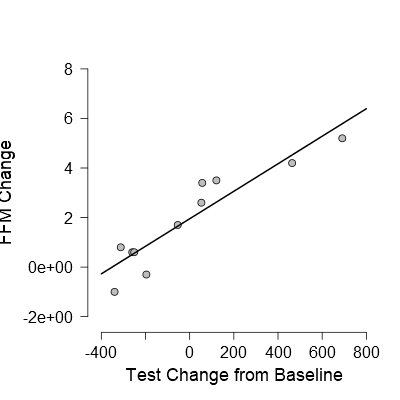
Change in fat-free mass in relationship to change in testosterone from baseline, within a range of change from -340 ng/dL to +691 ng/dL. Slope of line = 0.006, meaning an additional 0.6 kg in FFM for each 100 ng/dL increase in testosterone. R-Squared = 0.85. Data from Bhasin et al. 2001, 2005, and 2012.
The value of 0.6 kg of FFM for every 100 ng/dL increase is in agreement with a dose-response study by Huang and colleagues in hysterectomized women. They also found FFM to increase by 0.6 kg for every 100 ng/dL increase in testosterone.
We can also run a regression on the data I discussed earlier by Finkelstein and colleagues, where testosterone levels were suppressed and then subjects were given different doses of a testosterone gel. While the actual lean mass numbers weren't reported from this study, we can estimate them from the reported baseline values and percentage changes. For each 100 ng/dL increase in testosterone, fat-free mass increased by 0.3 kg. The R-squared for the model fit is 0.70, which is good.

Change in fat-free mass in relationship to change in testosterone from baseline. Slope of line = 0.003, meaning an additional 0.3 kg in FFM for each 100 ng/dL increase in testosterone. R-Squared = 0.70. Data from Finkelstein et al. 2013.
While we could also try to run a regression on some of the studies discussed where testosterone levels were low and brought up into a physiological normal range, the problem with these is that they all used different methods of delivery for testosterone (injection vs. gel vs. patch), which can have different dynamics in terms of how blood levels are changed. Also, the problem with trying to aggregate different injection studies is that they vary in the time in which they measure testosterone, and also vary in terms of the frequency of injections. You can have a very different testosterone measurement if you measure 1 week after an injection, versus 2 weeks.
However, we can take a look at studies where a drug was administered that stimulated natural testosterone production; such studies may better mimic how lean mass responds to variations in endogenous testosterone levels. Dias et al. gave men anastrozole, an aromatase inhibitor. By inhibiting aromatase, the enzyme that converts testosterone to estrogen, you can effectively increase testosterone levels. Theoretically, these testosterone levels would be relatively stable, as they would represent endogenous testosterone levels rather than exogenous testosterone from injection or transdermal delivery. Anastrozole increased testosterone from 272 ng/dL to approximately 500 ng/dL at 6 months, and lean mass increased by 1.5 kg. That's approximately 0.6 kg of FFM for every 100 ng/dL increase, which is in agreement with our previous analyses. Ribeiro and Abucham gave hypogonadal men clomiphene citrate, which increases endogenous (the levels within the body, versus exogenous like from an injection or cream) testosterone by binding to estrogen receptors. By binding to estrogen receptors, it tricks the brain into thinking there's not as much estrogen in the body. This leads the brain to pump out more leuteinizing hormone (LH), which then stimulates the testicles to produce more testosterone. Testosterone levels in responders increased from 201 ng/dL to 435 ng/dL after 3 months, and lean mass increased by 1 kg. That's 0.4 kg for every 100 ng/dL increase in testosterone. Liu et al. injected HCG into men who had borderline low testosterone leves; HCG is a hormone that stimulates the testicles to produce more testosterone. Testosterone increased from 320 ng/dL to around 720 ng/dL, a 400 ng/dL increase. Lean mass increased by 2 kg. That's 0.5 kg of lean mass for every 100 ng/dL increase in testosterone, which again is in agreement with the range we've established. Finally, Bayram et al. injected hypogonadal men with HCG. Testosterone increased from 39 ng/dL to 512 ng/dL, an increase of 473 ng/dL. Lean mass increased by 2.8 kg. That's 0.6 kg for every 100 ng/dL increase. Therefore, these 4 studies suggest an increase in 0.5 - 0.6 kg of lean mass for every 100 ng/dL increase in testosterone, which is in agreement with the Bhasin and Huang regressions.
Putting all of this together, the data suggests that fat-free mass will increase by 0.7 - 1.3 lbs (0.3 - 0.6 kg) for every 100 ng/dL increase in blood levels of testosterone within the physiological range. Thus, if you went from 300 ng/dL to 600 ng/dL, that would be 0.9 - 1.8 kg or about 2.1 - 4 lbs.
Now, keep in mind there are limitations to this analysis. First, it is based on averages; individual outcomes may be different. For example, as mentioned earlier, Finkelstein et al. showed a wide variation in how subjects responded to different levels of testosterone. Second, it is based on between-subject analyses; what happens within people may be different than what is observed between people. Third, some of it is based on exogenous testosterone injections. The problem with this is that, with injections, the average blood testosterone levels will be higher than what is measured. This is because, when you inject testosterone, you get a big peak in blood levels, and then it slowly decays over 1-2 weeks. Researchers usually measure testosterone at the trough of the decay after injection, usually 1-2 weeks later. This limitation becomes evident when you look at some of the Bhasin dose-response data. For example, in the Bhasin 2001 study, the men receiving 125 mg of injected testosterone gained 3.4 kg of lean mass, but the measured blood testosterone level of 542 ng/dL was similar to the natural baseline level of the subjects before they had their testosterone levels suppressed. Thus, their average testosterone levels were likely much higher than 542 ng/dL. While this is certainly a big limitation in the analysis, it should also be remembered that, with the regression, we're primarily assessing the differences in fat-free mass between different testosterone levels, rather than the relationship with any particular absolute level. In other words, we're looking at how fat-free mass changes for a 100 ng/dL change in testosterone, rather than how fat-free mass relates to, say, a 500 ng/dL blood level. Thus, even if the testosterone levels are due to exogenous injections, and even if the average levels are much higher than measured at the trough, the relationship between levels shouldn't change drastically. It should also be noted that the 0.6 kg/100 ng/dL relationship found in the Bhasin studies held up in women given much lower doses. Nevertheless, it's still a limitation that needs to be considered.
One interesting thing to note is that variations within a physiological range may have more of an impact than variations outside the physiological range. In other words, fat-free mass just doesn't increase in a linear fashion with increasing testosterone levels. When you get above the physiological range, the slope of the relationship decreases, and testosterone doesn't have as much of an impact. This becomes apparent when we again look at our regression of the three Bhasin studies, but this time include the data that is well above the physiological normal range.

You can see that the curve fits the data better than the straight line. The slope for the straight line is 0.002, meaning fat-free mass increased by 0.2 kg for every 100 ng/dL in testosterone, which is lower than the 0.6 kg we observed with the same data earlier. The model fit is also not as good (R-Squared = 0.77). This is because the extremely high testosterone levels attenuate the relationship. Each 100 ng/dL increase in testosterone doesn't have as strong of an effect at supraphysiological ranges compared to the normal physiological range.
This is also supported when we take a look at the 1996 Bhasin study on high dose testosterone that I mentioned earlier. Blood testosterone increased by approximately 2326 ng/dL in the testosterone-only group, and fat-free mass increased by 3.2 kg. That's a 0.13 kg increase for every 100 ng/dL increase in testosterone, which is not far from the 0.2 kg increase mentioned earlier when we included high testosterone doses.
What About the Women?
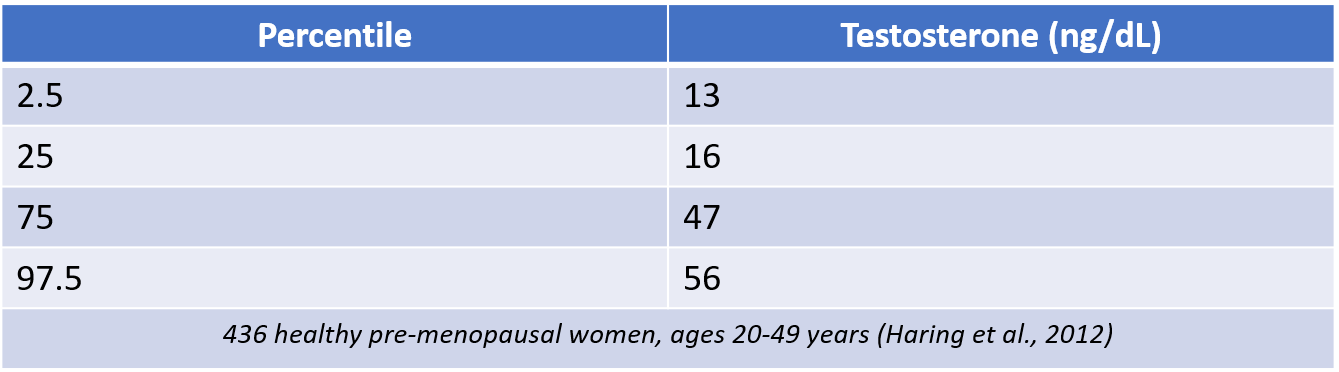
Women have much lower testosterone levels than men, and there's limited data to establish reference ranges on women. One of the issues is that some traditional lab assays for testosterone, like radioimmunoassays (RIA), are not sensitive enough to accurately measure testosterone in women. Accurate measurements of testosterone in women require sensitive techniques like liquid chromatography-tandem mass spectrometry (LC-MS/MS). There is a some data establishing reference ranges using this technique. Here's data from Haring and colleagues showing the lowest and highest percentiles for premenopausal women 20-49 years of age (note that I'm mixing some of the actual distribution data to get the 25th and 75th percentile, with their quantile regression models to get the 2.5th and 97.5th percentile, but for our purposes that is perfectly fine).
Similar to men, testosterone declines with age.
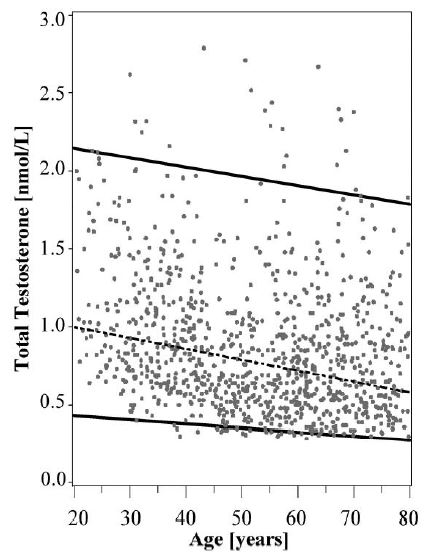
Testosterone measured by GC-MS/MS in 985 women. Data from Haring et al., J Clin Endocrinol Metab, 2012. 1 nmol/L = 0.0347 ng/dL
It was also found that women on oral contraceptives or hormone replacement therapy had lower testosterone levels on average, although the upper percentile range was higher. The 25th percentile for these women was 10 ng/dL (vs 13), and the 75th percentile was 56 ng/dL (vs 47).
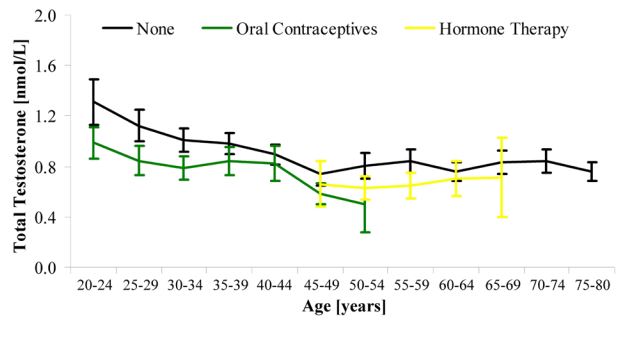
Testosterone by age in women, comparing women on oral contraceptives or HRT to those who are not. Data from Haring et al., J Clin Endocrinol Metab, 2012. 1 nmol/L = 0.0347 ng/dL
Rariy et al. did not find any relationship between total testosterone and lean mass in elderly women (ages 67-94 years), but did observe a significant relationship between free testosterone and lean mass (free testosterone is the form that is not bound to any proteins, hence the term "free").
We can also look at data where women with low testosterone were given exogenous testosterone. Again, the data is limited, but there are a few studies.
- Gruber and colleagues gave postmenopausal women (average age of 51 years) topical testosterone or a placebo for 6 months. Now, it should be noted that in this study, the women did not have low testosterone (average levels were 29 ng/dL, which is within a normal range). Testosterone increased to just above the normal range (72 ng/dL), and there was no impact on lean mass.
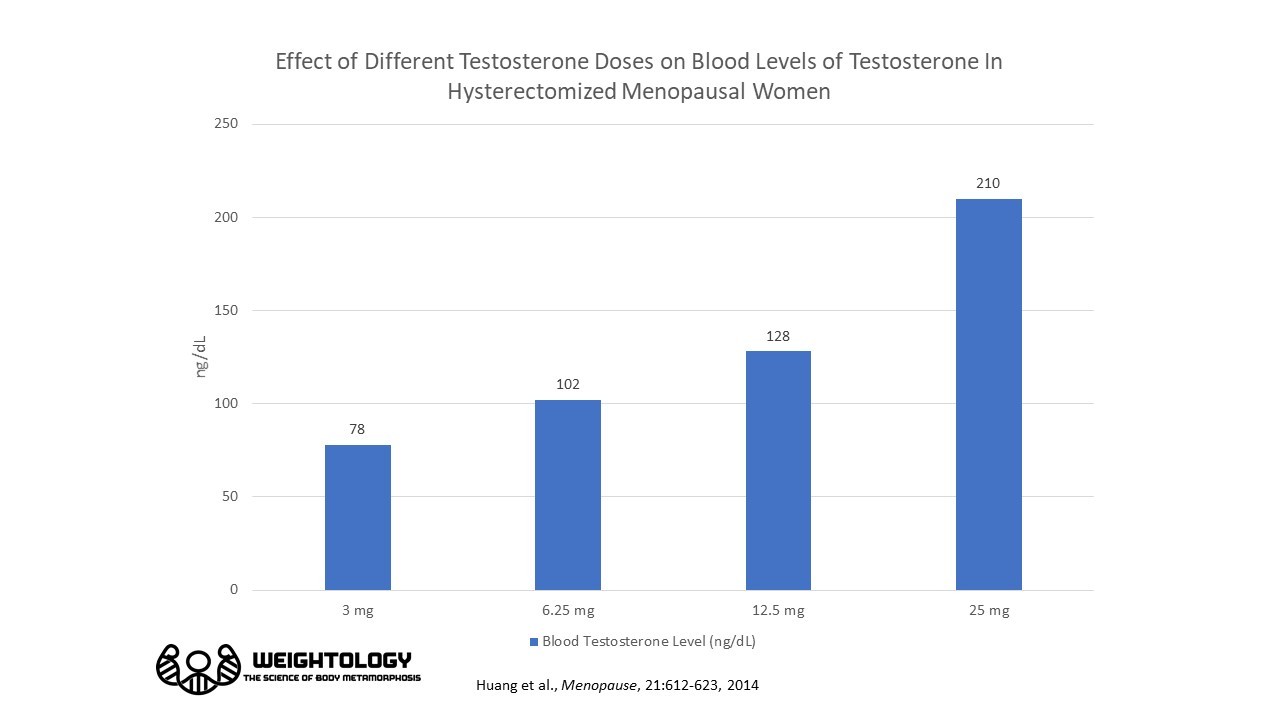
- Huang and colleagues performed a dose-response testosterone study on hysterectomized women. This was an important study; women going through menopause typically don't see much of a change in circulating testosterone, as the ovaries continues to secrete testosterone. However, if a women undergoes a hysterectomy, there is a 29% decrease in testosterone, and if both ovaries are removed, then there is around a 40% decrease in testosterone. Women who have had ovaries removed experience greater deterioration in sexual function compared to naturally menopausal women, despite having estrogen therapy. Thus, some have speculated that these women may benefit from testosterone therapy to improve sexual function. Also, given that age-related decline in testosterone levels in older women is associated with frailty, some have argued that very low dose replacement may have benefits in improving lean mass and physical function. Huang et al recruited 71 menopausal women who previously underwent hysterectomy, with or without ovary removal. Average testosterone levels were 13 ng/dL. They received weekly testosterone injections of 3, 6.25, 12.5, or 25 mg of testosterone enathnate, or a placebo, for 6 months. Blood testosterone levels increased in a dose-dependent fashion. However, the increase in lean mass was only statistically significant at the highest dose (1.8 kg). Lean mass increased by 0.6 kg for every 100 ng/dL increase in blood testosterone. Statistically significant increases in sexual function were only found at the highest dose, although some non-significant improvement was found at the 12.5 mg dose.

Change in lean mass with different testosterone doses in hysterectomized menopausal women. Data from Huang et al, Menopause, 2014. Only the 25 mg dose resulted in a statistically significant increase. Lean mass increased by 0.6 kg for every 100 ng/dL increase in testosterone, which is outside the normal physiological range for women (13 - 56 ng/dL).
This data suggested that you need to raise blood levels of testosterone well outside a physiological normal range (towards the very low end of a male) in post-menopausal women to get measurable increases in lean mass and sexual function.
Overall, this data indicates that variations in testosterone in women, within the normal physiological range, have very little, if any, measurable impact on muscle. This is not surprising if we consider the 0.3 - 0.6 kg increase for every 100 ng/dL increase in testosterone that we've discussed. The normal range for females goes from 13 to 56 ng/dL, a span of only 43 ng/dL. That only amounts to a quarter of a kilogram (a half a pound) or less in women.
Putting It All Together
When we examine the entire body of evidence, it is clear that variations in physiological testosterone levels impact how much muscle you carry, but will have minimal impact on your relative (%) gains. To summarize:
- Cross-sectional data, dose-response studies, and TRT studies all support variations within the normal range as having an impact on fat-free mass and muscle.
- Variations in your blood levels of testosterone impact your "base" level of muscle, but has minimal impact on your relative (%) gains. Thus, having higher testosterone levels means having a higher base level of muscle. While the relative gains will be mostly similar, the absolute gains will be higher due to the higher baseline.
- The impacts of testosterone and resistance training on fat free mass and muscle are mainly additive rather than synergistic.
- Baseline fat-free mass increases by approximately 0.7 - 1.3 lb or 0.3 - 0.6 kg for every 100 ng/dL increase in physiological testosterone; this is based on averages and between-subject data, so individual outcomes may vary considerably. There are also limitations to this analysis, such as the fact that some of it is based on dose-response data from injections, which may not accurately reflect changes in endogenous levels.
- The impact of testosterone on FFM is attenuated at supraphysiological levels (>1500 ng/dL); baseline FFM increases by about 0.1 to 0.2 kg for every 100 ng/dL for those levels.
- Variations in testosterone in women, within the normal physiological range, have very little, if any, measurable impact on muscle.
So, yes, guys with higher testosterone do have an advantage in terms of having more absolute muscle. This data also indicates that aging men, with borderline low or low testosterone levels, may get a muscle-building benefit from therapies designed to boost testosterone levels, whether from exogenous sources (like injections or gels) or sources that stimulate testosterone production (like clomiphene, HCG, or aromatase inhibitors), even if they already train with weights.
Excellent analysis, thorough and scientific. I found it very informative.
Thanks!
incredible article. keep up the good work.
Thanks!
I noticed that men that had Testosterone levels in the 95th percentile had a sharper decline of testosterone around the age of 55. More than the others who had lower levels prior to that age. Why did those men decline so much compared to the other groups?
Not sure…perhaps a regression to the mean effect